Using the fishery vulnerability scores from Step 4 and the depletion scores from Step 5, fill out the tables in Step 6 of your Workbook to help organize and then prioritize your target species for further assessment and precautionary management. See Tables 1a and 1b for examples of this process.
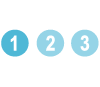
STEP 6, TABLE 1a | EXAMPLE ORGANIZATION MATRIX
Stocks caught by the fishery are first organized into the 9 cells of the table based on their vulnerability levels (from Step 4) and depletion/ health statuses (from Step 5).
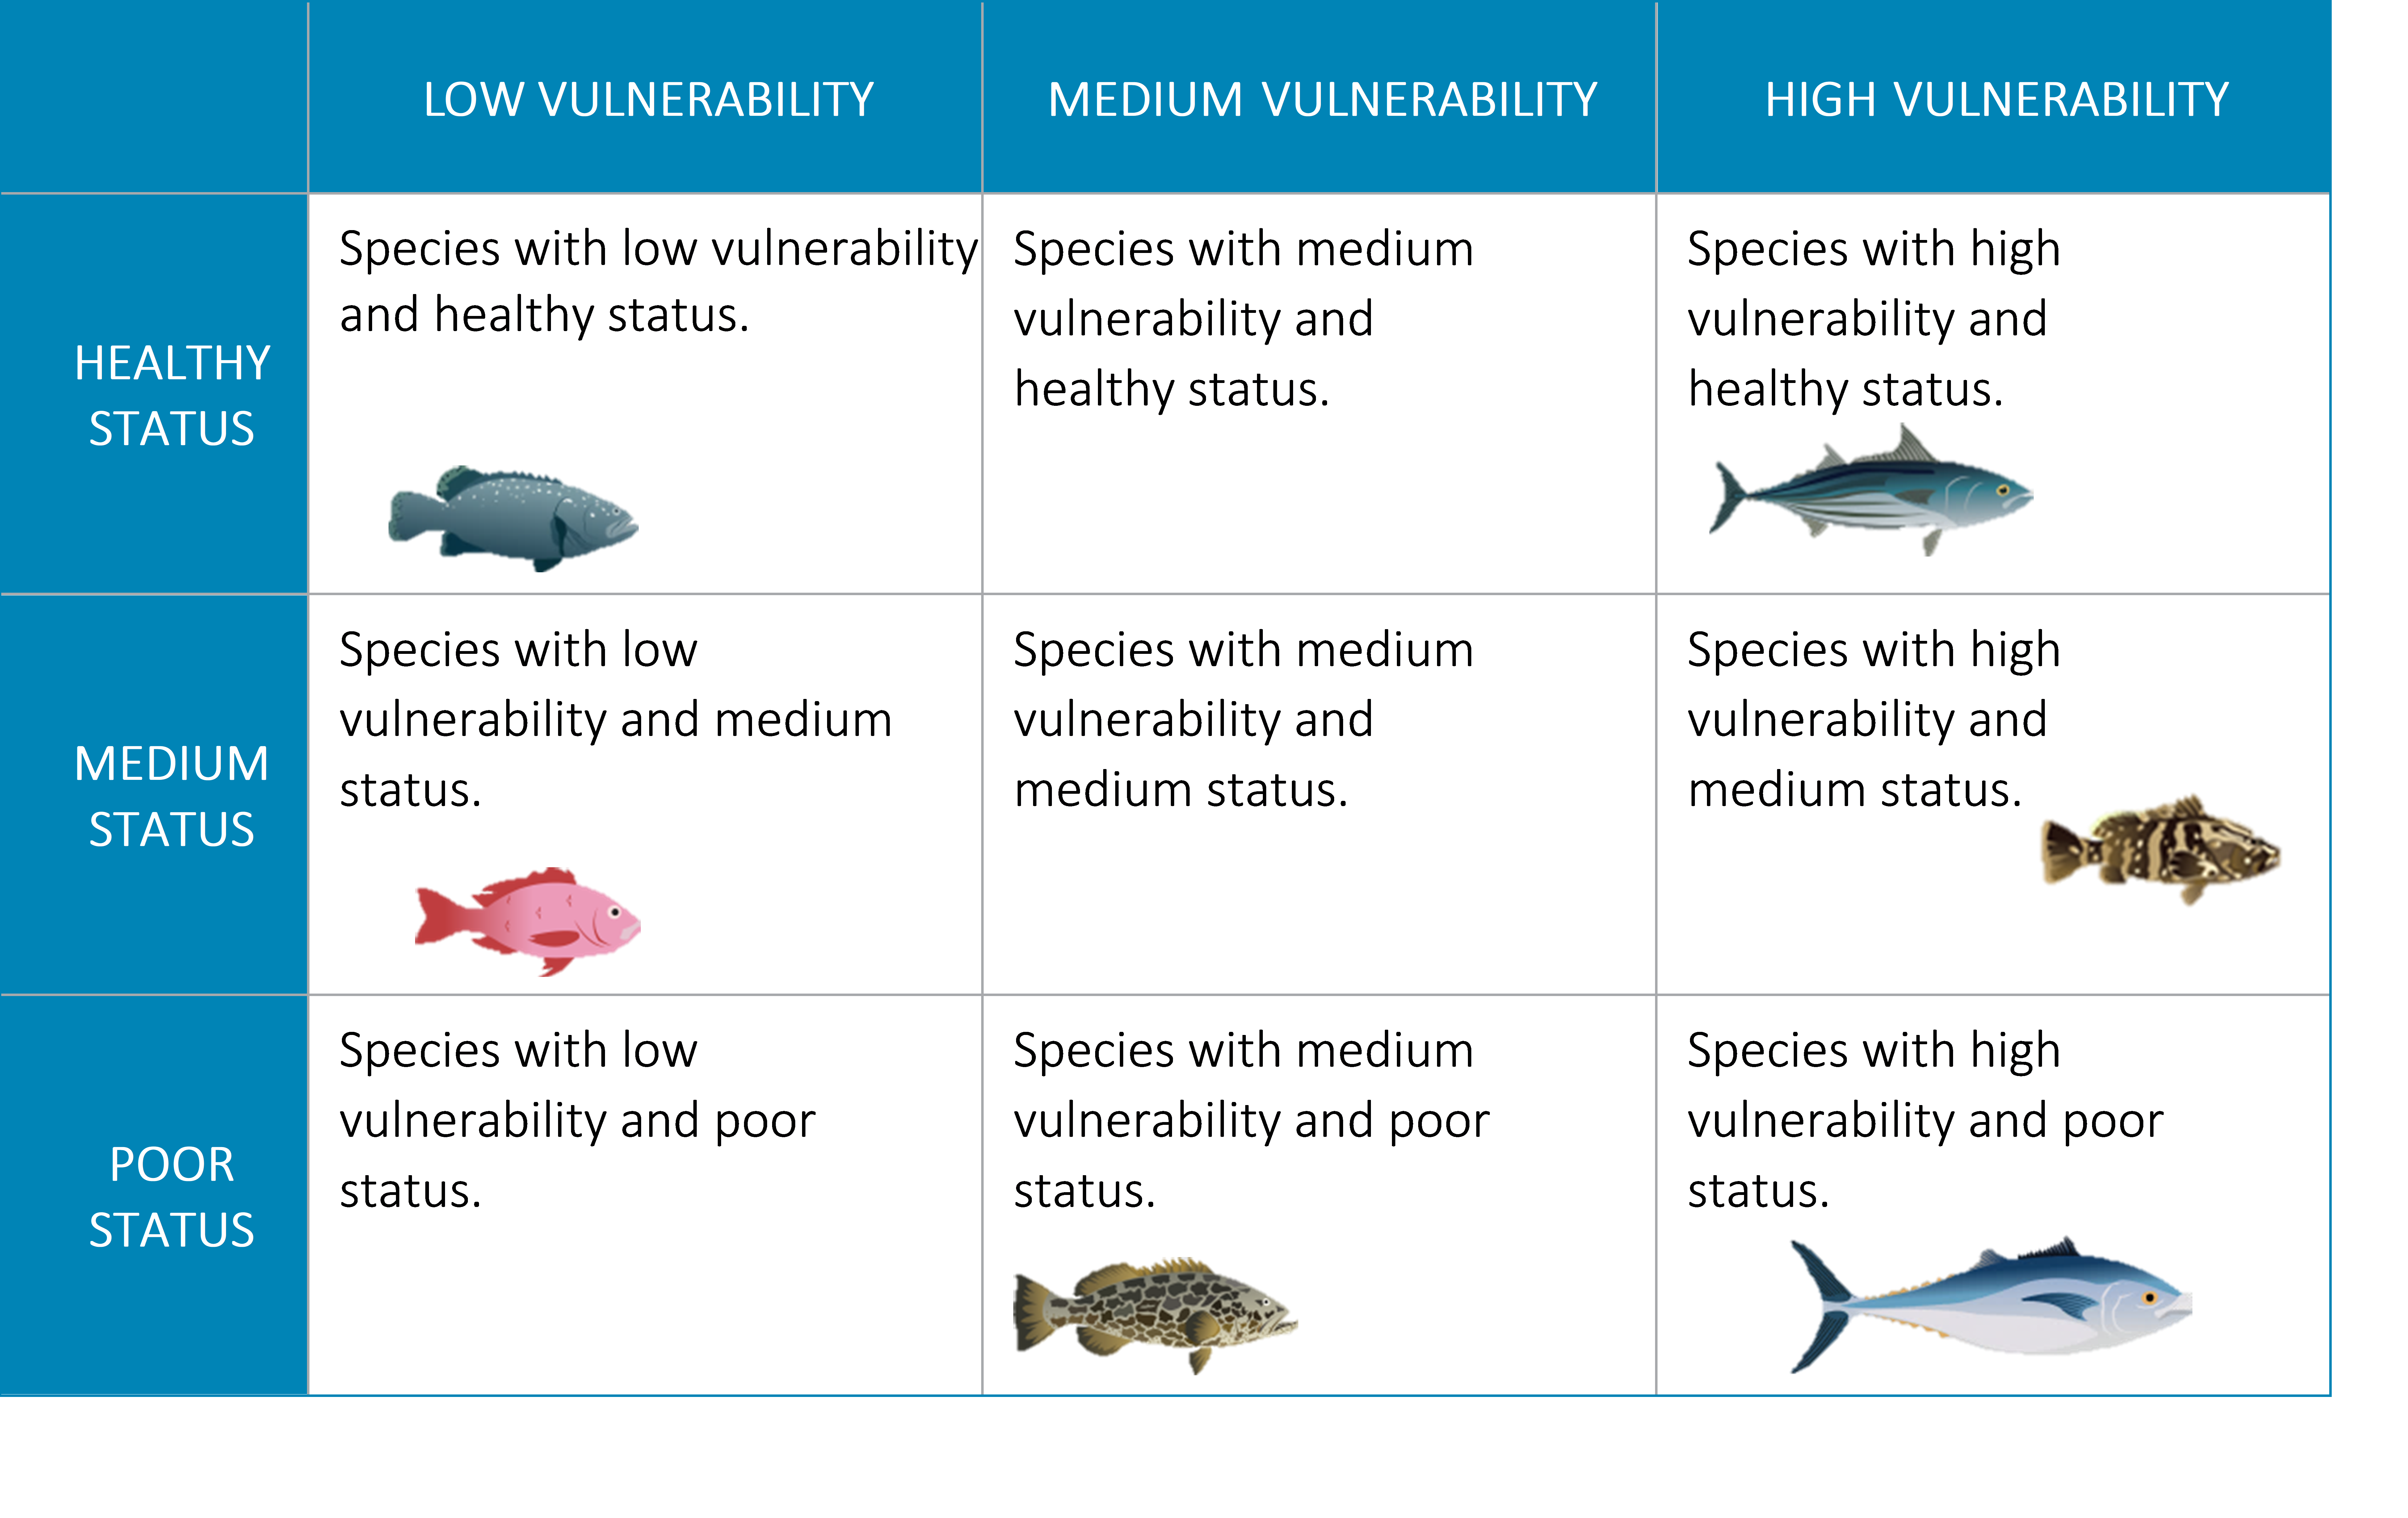
STEP 6, TABLE 1b | EXAMPLE ORGANIZATION MATRIX PLUS MANAGEMENT BASKETS (FOR MULTISPECIES FISHERIES)
In multispecies fisheries, where many species are caught at the same time with the same gear, species can be organized into “management baskets” based on their vulnerability and status levels (i.e. placement in the table), but also incorporating catch methods, risk tolerance, and value (commercial and social). The 9 cells of the table can be seen as a starting point for the creation of management baskets, and managers can decide to merge cells or split species out, as appropriate for their fishery. In the example in this table (Table 1b), managers have created eight baskets by grouping all species in the Low Vulnerability column (the parrotfish, black grouper, and silk snapper), grouping three species with Healthy Status, but Medium and High Vulnerability (a sardine, a mackerel, and the skipjack tuna), and separating out (creating baskets of one) all the species with Poor or Moderate Status, as well as the clams, which have Healthy Status and High Vulnerability (like the skipjack tuna), but are caught with a different gear/ method than the tuna.
Once the baskets have been defined, at least one “representative species” must be selected from each basket for which additional assessments may be conducted, and management strategies defined, which will then be applied to all species in the basket. Representative species (for baskets containing more than one species) should be chosen based on: which species has the most data available; which species has the highest vulnerability score of the group (choose this species as the representative to be precautionary); which species has a vulnerability score that falls right in the middle of the others in the group; and which species has characteristics/ life cycle patterns and behaviors that might make it a good representative for the others in the group (e.g., perhaps one species uses multiple key habitats throughout its life). Finally, note that the criteria applied to choose the representative species may be different for each group. In Table 1b above, representative species for each basket are highlighted in yellow. In this example, fisheries managers would carry forward 8 species for further assessment and management, rather than all 12 that their fishery impacts.
When creating management baskets, managers must keep in mind the tradeoffs between having more baskets (and therefore more representative species to complete detailed assessments on) with fewer species in each, and having fewer baskets that each contain wider ranges of vulnerability, health status, or both. For instance, in the example above the basket that groups all species in the Low Vulnerability column contains two species that are very healthy, but one species – the silk snapper – that is less so. If managers are not careful when developing management tactics for this basket of fish the snapper may be at risk of overfishing. Similarly, the basket that combines the sardine and mackerel (both Medium Vulnerability stocks) with the skipjack tuna (a High Vulnerability stock) puts the tuna at a greater risk. These risks can be minimized by emphasizing vulnerability when creating the management baskets, assessing and managing the most vulnerable species separately, or selecting the lowest health/ highest vulnerability species in each basket as the representative species. Importantly, this may not always be the species fishers and managers are most interested in from an economic perspective.