Step 4. Vulnerability Assessment
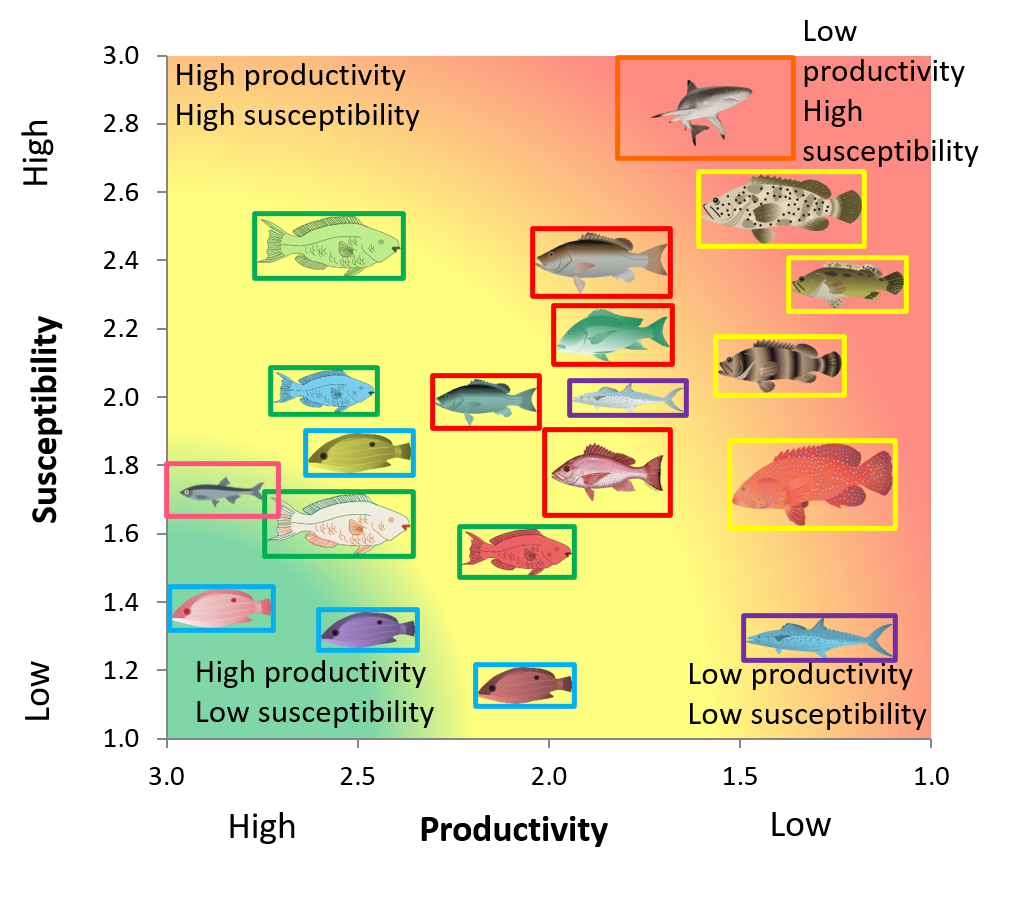
A Productivity Susceptibility Analysis (PSA) was conducted on 20 fish species targeted by the fishery to assess the vulnerability of each species. In the figure below, members of the snapper family are indicated in red boxes, groupers in yellow, grunts in blue, wrasses in green and jacks in purple. The Caribbean reef shark is in orange and the thread herring in pink. This analysis takes into account the productivity of each stock (based on life history information from FishBase, local expertise, and literature review) and the susceptibility of each stock (based on information from FishBase, literature review, and communications with local stakeholders).
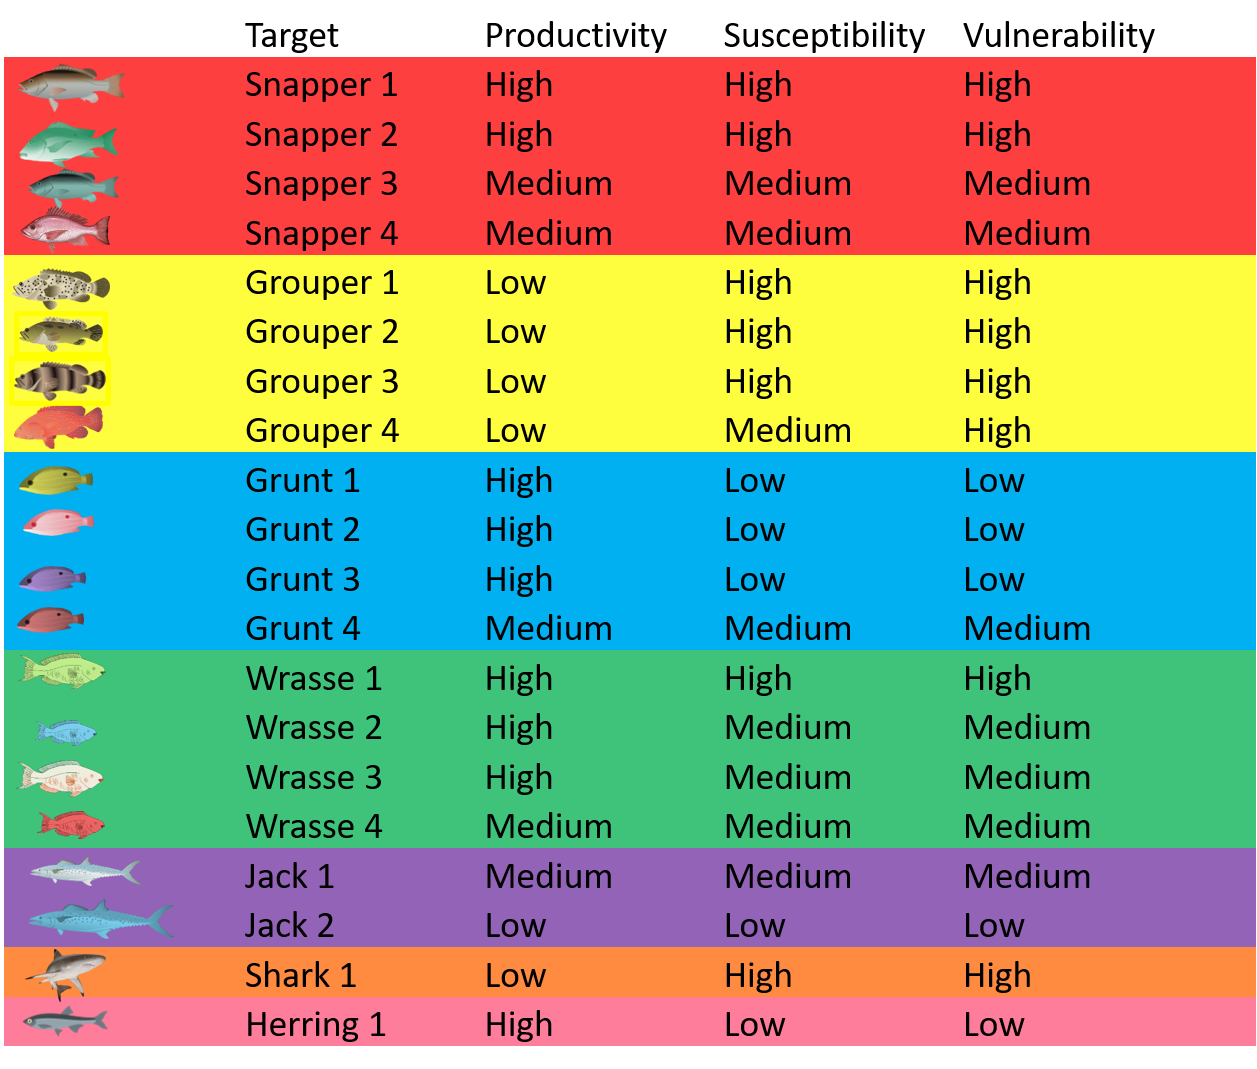
The figure below shows the results of this analysis for these 20 species. Several species were all found to have moderate vulnerability and risk, including some of the snappers (e.g., Snapper 3 and Snapper 4), wrasses (e.g., Wrasse 2- Wrasse 4), a jack (e.g., Jack 1) and a grunt (e.g. Grunt 4). All of the groupers were all found to have high vulnerability and risk (e.g., Grouper 1, Grouper 2, Grouper 3 and Grouper 4), as was the shark. It should be noted that this analysis is simply meant to provide a high-level view of potential risk and to prioritize stocks for further analysis. The PSA should be used in conjunction with more robust and targeted assessment methods whenever possible.
PSA Results Graph:
(Color boarders around icons indicate species groups)
PSA Results in table format:
(Color coding for each species group corresponds to boarders around icons in the graph above)