
The fourth step of the 11 Step FISHE Framework is to assess the vulnerability of target stocks to fishing pressure using basic biological and fishery information. This is most often done using the Productivity and Susceptibility Analysis (PSA) model. Even if fishery data such as landings, effort or length frequency of the catch are not available, a PSA can inform management decisions by indicating which stocks should be prioritized for further assessment and precautionary management. PSA is similar to the climate vulnerability analysis you might have conducted at Step 1, but rather than exploring the vulnerability of a species (or ecosystem) to climate change, PSA zeros in on the vulnerability of different species to the specific activities associated with a given fishery.
When working in a multispecies fishery it may be tempting to try to group species together and only apply a PSA to one representative from each group (e.g. one representative grouper). However, we strongly advise against doing this. Although applying the PSA to every species caught by the fishery (both targets and non-targets) may take a relatively large amount of time and capacity, assuming one species can represent others without having an understanding of each of their individual life history characteristics and relationships with the fishery is very risky. This is because individual species within a family or class can still have drastically different productivity and susceptibility characteristics, and management decisions made based on the PSA results for one species may not be sufficient to prevent overfishing of another. For this reason, we recommend applying the PSA to each species impacted by the fishery. Once this assessment has been completed, the resulting vulnerability scores can be used to make a more informed decision about how to group species for further assessment and management, if necessary.

The PSA requires information on the life history of a species, including the length at first maturity, maximum length, fecundity, breeding strategy, growth rate and natural mortality. This information is used to estimate the biological productivity of the stock, which is ranked on a 1-3 scale. These parameters can typically be obtained from the literature or online databases, but when possible, information from local studies and stakeholder/expert interviews should be used. Qualitative information may be used if specific measurements are lacking. All values should be vetted with local biologists and fishermen to increase reliability.
Information on the nature of the fishery, including the geographic overlap of the fishery and fish stocks, current management practices, value of the fishery and impacts on habitat is needed to estimate the susceptibility of the stock to overfishing. Susceptibility scores are also ranked from 1-3. Again, much of this information can be qualitative and gleaned from interviews with fishermen and managers.
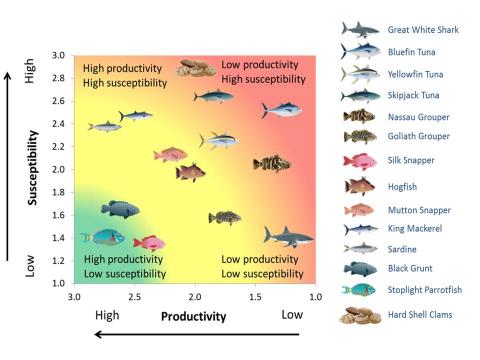
Final vulnerability scores from the PSA - based on both productivity and susceptibility - can be grouped into low, moderate, and high categories to facilitate integration with other analyses. Scores under 1.8 are associated with low vulnerability stocks, scores from 1.8-2.0 are associated with moderate vulnerability, and scores above 2 are associated with highly vulnerable stocks. Stocks can also be plotted on a PSA graph, as in Step 4, Figure 1 below.
Blank PSA worksheets (in English and Spanish), as well as a “Primer” guidance document, can be found in the Step 4 methods of the downloadable Workbook.
Inputs:
- Life history information including length at maturity, growth rate, maximum length, and aggregation behavior
- Fishery information including gear and fishing practices
- Expert knowledge of fish biology and behavior
- Expert knowledge of how the fishery operates, especially with respect to characteristics that affect catchability of target species
Outputs:
- Productivity score - the biological capacity of the target population to produce its maximum sustainable yield and to recover if the population is depleted
- Susceptibility to fishing score - potential for the target to be impacted by the fishery through direct capture as well as indirect impacts, such as bycatch
- Vulnerability score – the overall vulnerability of the stock to overfishing
Assumptions:
- Life history parameters are known, or can be borrowed from similar species in a similar geographic location
- Scoring of productivity and susceptibility attributes is accurate and standard across species being evaluated