The third step of the integrated framework is to qualitatively assess the status of the marine ecosystem and the associated impacts of fishing and other system stressors. This step is important because healthy ecosystems are more resilient to any impact, including those associated with fishing and with climate change. In addition, other impacts besides fishing, like pollution of loss of habitats due to coastal development or sea level rise, can affect the success of fishery management, both in terms of sustaining fishery yields and maintaining ecosystem health. In a multispecies fishery it may be necessary to identify differential impacts on different habitat components that are critical to the health of each of the species being caught, such as spawning grounds and feeding areas.
Ecosystem assessments can be done using local and/or expert knowledge of the area, or through simple-to-gather measurements such as fish density (number of fish per unit area). Ecosystem assessments can be used to prioritize management measures to address the impacts that pose the highest levels of risk to ecosystems, and (if quantitative information is available), to set targets for fish biomass that are consistent with healthy ecosystems.
Users can apply any of the four methods outlined below to improve their understanding of the status of their local ecosystem. The General Resilience Attributes Checklist is a very simple tool to guide users in understanding a set of recognized attributes of generalized system resilience and exploring whether or not they are present in their systems. If a Comprehensive Assessment of Risk to Ecosystems (CARE) was conducted at Step 1 of the FISHE process, these results can be revisited here at Step 3 with a focus on current and future threats to system health. If this assessment was not conducted at Step 1, now is a good time to integrate it into your process. The Ecological Risk Assessment for the Effects of Fishing is similar to CARE in that it is a system-wide risk assessment, but this tool focuses only on the impacts of the fishery itself (rather than all system threats), and is thus able to explore the impacts of fishing activities in more depth. The Ecosystem Thresholds for Coral Reefs method is one of the few methods that we are aware of that is explicitly designed to assess ecosystem health in a multispecies fishery setting, although the CARE and ERAEF methods can also be applied in multispecies fisheries.
Resilience is the capacity of socio-ecological systems to support the achievement of goals in response to stressors– even when these stressors interact unpredictably over time. All fisheries are socio-ecological systems in which humans and natural ecosystems interact. Resilient fisheries have the capacity to resist, recovery from, adapt to, or transform in response to disturbances such as price shocks, demographic changes, storms, and changes in the distribution and abundance of fish such that they can continue to generate desirable levels of food, profits, jobs, biodiversity, and other ecosystem services over time.
There has been a significant amount of research and exploration into what makes one system more or less resilient than another. Various authors and groups have created lists of attributes thought to collectively characterize a resilient system, both in general as well as in relation to specific threats (e.g., the threat of climate change). Our General Resilience Attributes Checklist draws on this research, combining and adapting attribute lists from The Stockholm Resilience Center, The Resilience Alliance + Transition Movement, and a recent examination of specific climate-resilience criteria for fisheries.
It is necessary to consider resilience in a holistic way because resilience is a property of systems and each component of a socio-ecological system is highly connected to the others. For example, a lack of resilience in the socio-economic domain (e.g., a scarcity of livelihood options) or in the governance domain (e.g., poorly-designed regulations that fail to effectively control harvest) can lead to the degradation and potentially the collapse of a fishery even if the ecological domain has a high degree of diversity and redundancy. Thus, the more attributes of resilience a system has, and the more fully they are realized, the more likely the system will be to maintain its desirable human and natural attributes in the face of a shock or stressor.
Finally, it is critical to recognize that the property of resilience itself is inherently neither good nor bad. Having all the attributes of resilience will not ensure that the outcomes will be desirable or that goals will be met. A system can be resilient while simultaneously being in a highly degraded state (consider, for example, an overfished fishery which may take years or decades to recover). It is therefore necessary to consider these resilience attributes in addition to the building blocks of sustainability – some way to evaluate stock status using the best available science and local knowledge, a way to adjust fishing mortality in response to those evaluations, ways to maintain sustainable stock size and age structure, ways to maintain desirable yields and profits year after year, and ways to hold fishermen and managers accountable to sustainability standards.
Future ecosystem conditions will be contingent on cumulative impacts from multiple types of threats and stressors facing the system, including climate change impacts and interactions. The Comprehensive Assessment of Risk to Ecosystems (CARE) model is an Excel-based tool designed to systematically analyze the full suite of risks to selected “targets” (valued species and/ or ecosystems) within a spatially explicit site, from all of the potential “threats” that might impact that site. This tool quantitatively considers the interaction of all system threats and assesses the risk to the entire ecosystem through inclusion of a comprehensive suite of attributes to characterize system resilience. These attributes quantify intrinsic system recovery potential (i.e. “regeneration time” and “connectivity”) and sensitivity to impact (i.e. “removability of system components” and “functional redundancy and diversity”). In 2020 the tool was updated to include an explicit climate vulnerability assessment component that allows users in data limited systems to systematically evaluate the expected impact of climate change on their system in a user-selected future time period, as well as their system's vulnerability to that impact. The scoring process was also updated to allow for generation of climate-impacted relative threat risk scores for all threats present in a site in the same future time period.
The CARE model can be used to evaluate risks facing a single site; to compare multiple sites for suitability/necessity of different management options; or evaluate the effects of a proposed management action aimed at reducing one or more risks. Results of the CARE model can be used to identify which threats are the most important in a given site, and for a given target, both now and in a climate-impacted future. This information can help inform where limited management resources should be directed.
The assessments rely largely on local and expert knowledge, require minimal background research to complete, and can be implemented in the field in a matter of hours. These features make the CARE model singularly well-suited for use in Ecosystem Based Management in data-limited systems, for informing spatially explicit management decisions, and for prioritizing threats for efficient use of management resources.
In addition, a set of (Word Doc) questionnaires are provided to facilitate the collection of information necessary to complete a CARE analysis in the field, through interviews with fishers and other system experts.

In an Ecological Risk Assessment for the Effects of Fishing analysis (ERAEF), information from the literature, surveys and stakeholder interviews is used to generate a risk assessment that identifies the most vulnerable parts of the system (i.e., target species, bycatch species, threatened species, habitats, ecological communities). This analysis is used to detect high-risk activities that require immediate management attention and to screen out low-risk activities from further analysis. The three-step ERAEF analysis can be conducted in data-limited locations and can assimilate more data as they become available. The first two steps in the ERAEF (“scoping” and the Scale, Intensity, Consequence, Analysis (SICA)) comprise the qualitative ecosystem assessment. You'll be conducting the last step of the ERAEF, a Productivity and Susceptibility Analysis (PSA) for individual fish stocks, as Step 4 of the 11 Step Framework.

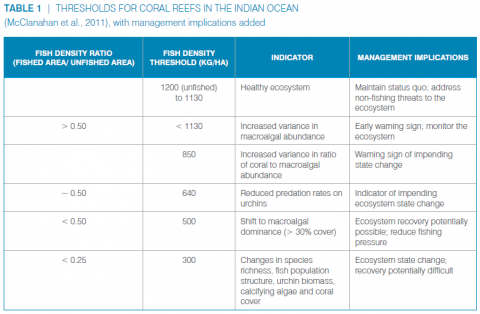
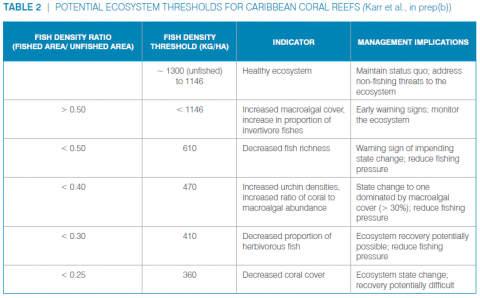
For some ecosystems, including coral reefs, recent studies show the existence of quantitative thresholds associated with fish densities (measured in kg/ha). Below these thresholds, ecosystems change from desirable (e.g., high coral cover) to less desirable states (e.g., dominated by algae) that produce fewer ecosystem services. Fisheries in ecosystems with documented fishing thresholds can be managed to remain above these limits, reducing the risk of system collapse. At the moment, thresholds have been documented for coral reefs in the Indian Ocean and the Caribbean Sea. Densities of fished populations and unfished populations can be measured with fishing or visual surveys, and the resulting ratio can then be compared to the threshold limits.
Use this calculator to determine the fish biomass ratio (kilograms/hectare) of your coral reef system and compare with the ratios for the Indian Ocean and Caribbean Sea in the tables below.
Please note this method is relatively new and has only been piloted in a limited number of settings. Users are encouraged to consult with local reef experts to interpret the density ratio they have calculated for their system.