In many fisheries, and especially in resource-limited fisheries, it may not be feasible to conduct extensive stock assessments and develop and apply comprehensive fishery management plans for every species being impacted by the fishery all at the same time. Instead, it is necessary to focus first on a subset of species in need of the most immediate attention and create a plan to come back to the other species later. In other words, it’s necessary to conduct a stock prioritization exercise. But how should we distinguish those species that are in greatest need of our attention sooner from those that can wait a bit before they are closely examined? Many factors might go into this decision but we recommend basing it on: 1) the vulnerability of each stock to impact by the fishery; 2) the current health/ depletion status of each stock (because just because a stock is less vulnerable to the fishery, that doesn’t mean it is necessarily currently in good health); and 3) the social, economic, and biophysical “value” of each species. In addition to all of these factors, climate change is likely to impact different species in different ways, and it is thus valuable to incorporate this information into the prioritization process.
Here we walk through a matrix approach to prioritizing species for further assessment and management that builds on the analyses conducted in the previous steps of FISHE. First, fishery vulnerability scores from Step 4 and stock depletion categories (low, medium, or high) from Step 5 are combined to organize each of the species impacted by the fishery into a matrix. This matrix then guides the prioritization of target species for further assessment and/or precautionary management. This prioritization process can help to produce management guidance for each species with each combination of vulnerability and depletion levels. Then, climate vulnerability information from Step 1 can be overlaid onto this current prioritization matrix to help inform decisions and actions aimed at fishery system resilience-building. An example of this approach is given in Tables 1a, 2a and 3a below.
For truly multispecies fisheries, where many species are caught all together with the same gear, this organization process can form the basis of the creation of species management “baskets,” or “tiers,” that can be used to implement a management strategy that involves applying different harvest controls to different categories of stocks based on their vulnerability to overfishing and their estimated depletion status. This approach is aimed at preventing the depletion of species that are not very productive and/or highly susceptible to fishing. This type of depletion often occurs sequentially, with large slow-growing highly valuable fish being depleted first, followed by species that are somewhat more productive and/or less valued, etc. until fisheries are left with few options but to target highly productive but low value species. This phenomenon is called “serial depletion,” or sometimes “fishing down the food web.” Serial depletion reduces fishing opportunities and can have adverse impacts on marine ecosystems.
In the fish baskets approach, species are first organized into the 9 cells of Table 1a, below, and then managers, scientists, and stakeholders consider several factors in order to put species in the right management baskets: 1) fishery vulnerability and depletion (i.e. location in the table); 2) stakeholder risk tolerance (i.e. how much risk of serial depletion are you willing to tolerate?); 3) value (commercial and social); and 4) how would each basket of species be managed in practice (e.g., if they are caught together with the same gear, maintaining fishing mortality at target levels is more feasible than if the species are caught with different types of gear). In other words, managers can choose to manage each cell of the table as its own basket, adjacent cells can be combined to generate fewer baskets that each have wider vulnerability and/or depletion ranges, or species can be “pulled out” of cells and managed on their own (potentially resulting in more than 9 baskets, Table 1b). Once species have been organized into management baskets, one or more representative species can be chosen from each basket for which further assessments can be conducted (FISHE Steps 7-9) and management measures defined (FISHE Steps 10 and 11). Representative species can be chosen based on data availability, individual vulnerability and depletion scores (i.e., scores at the high end for its basket, or right in the middle of other species in the basket, depending on your risk tolerance), life history similarity to other species in the basket (if known) and/ or value to the fishery. We also strongly recommend incorporating climate vulnerability information into this process of selecting management basket representative species. See Tables 1b, 2b and 3b below for an example of this prioritization approach for multispecies fisheries.
Using the fishery vulnerability scores from Step 4 and the depletion scores from Step 5, fill out the tables in Step 6 of your Workbook to help organize and then prioritize your target species for further assessment and precautionary management. See Tables 1a and 1b for examples of this process.
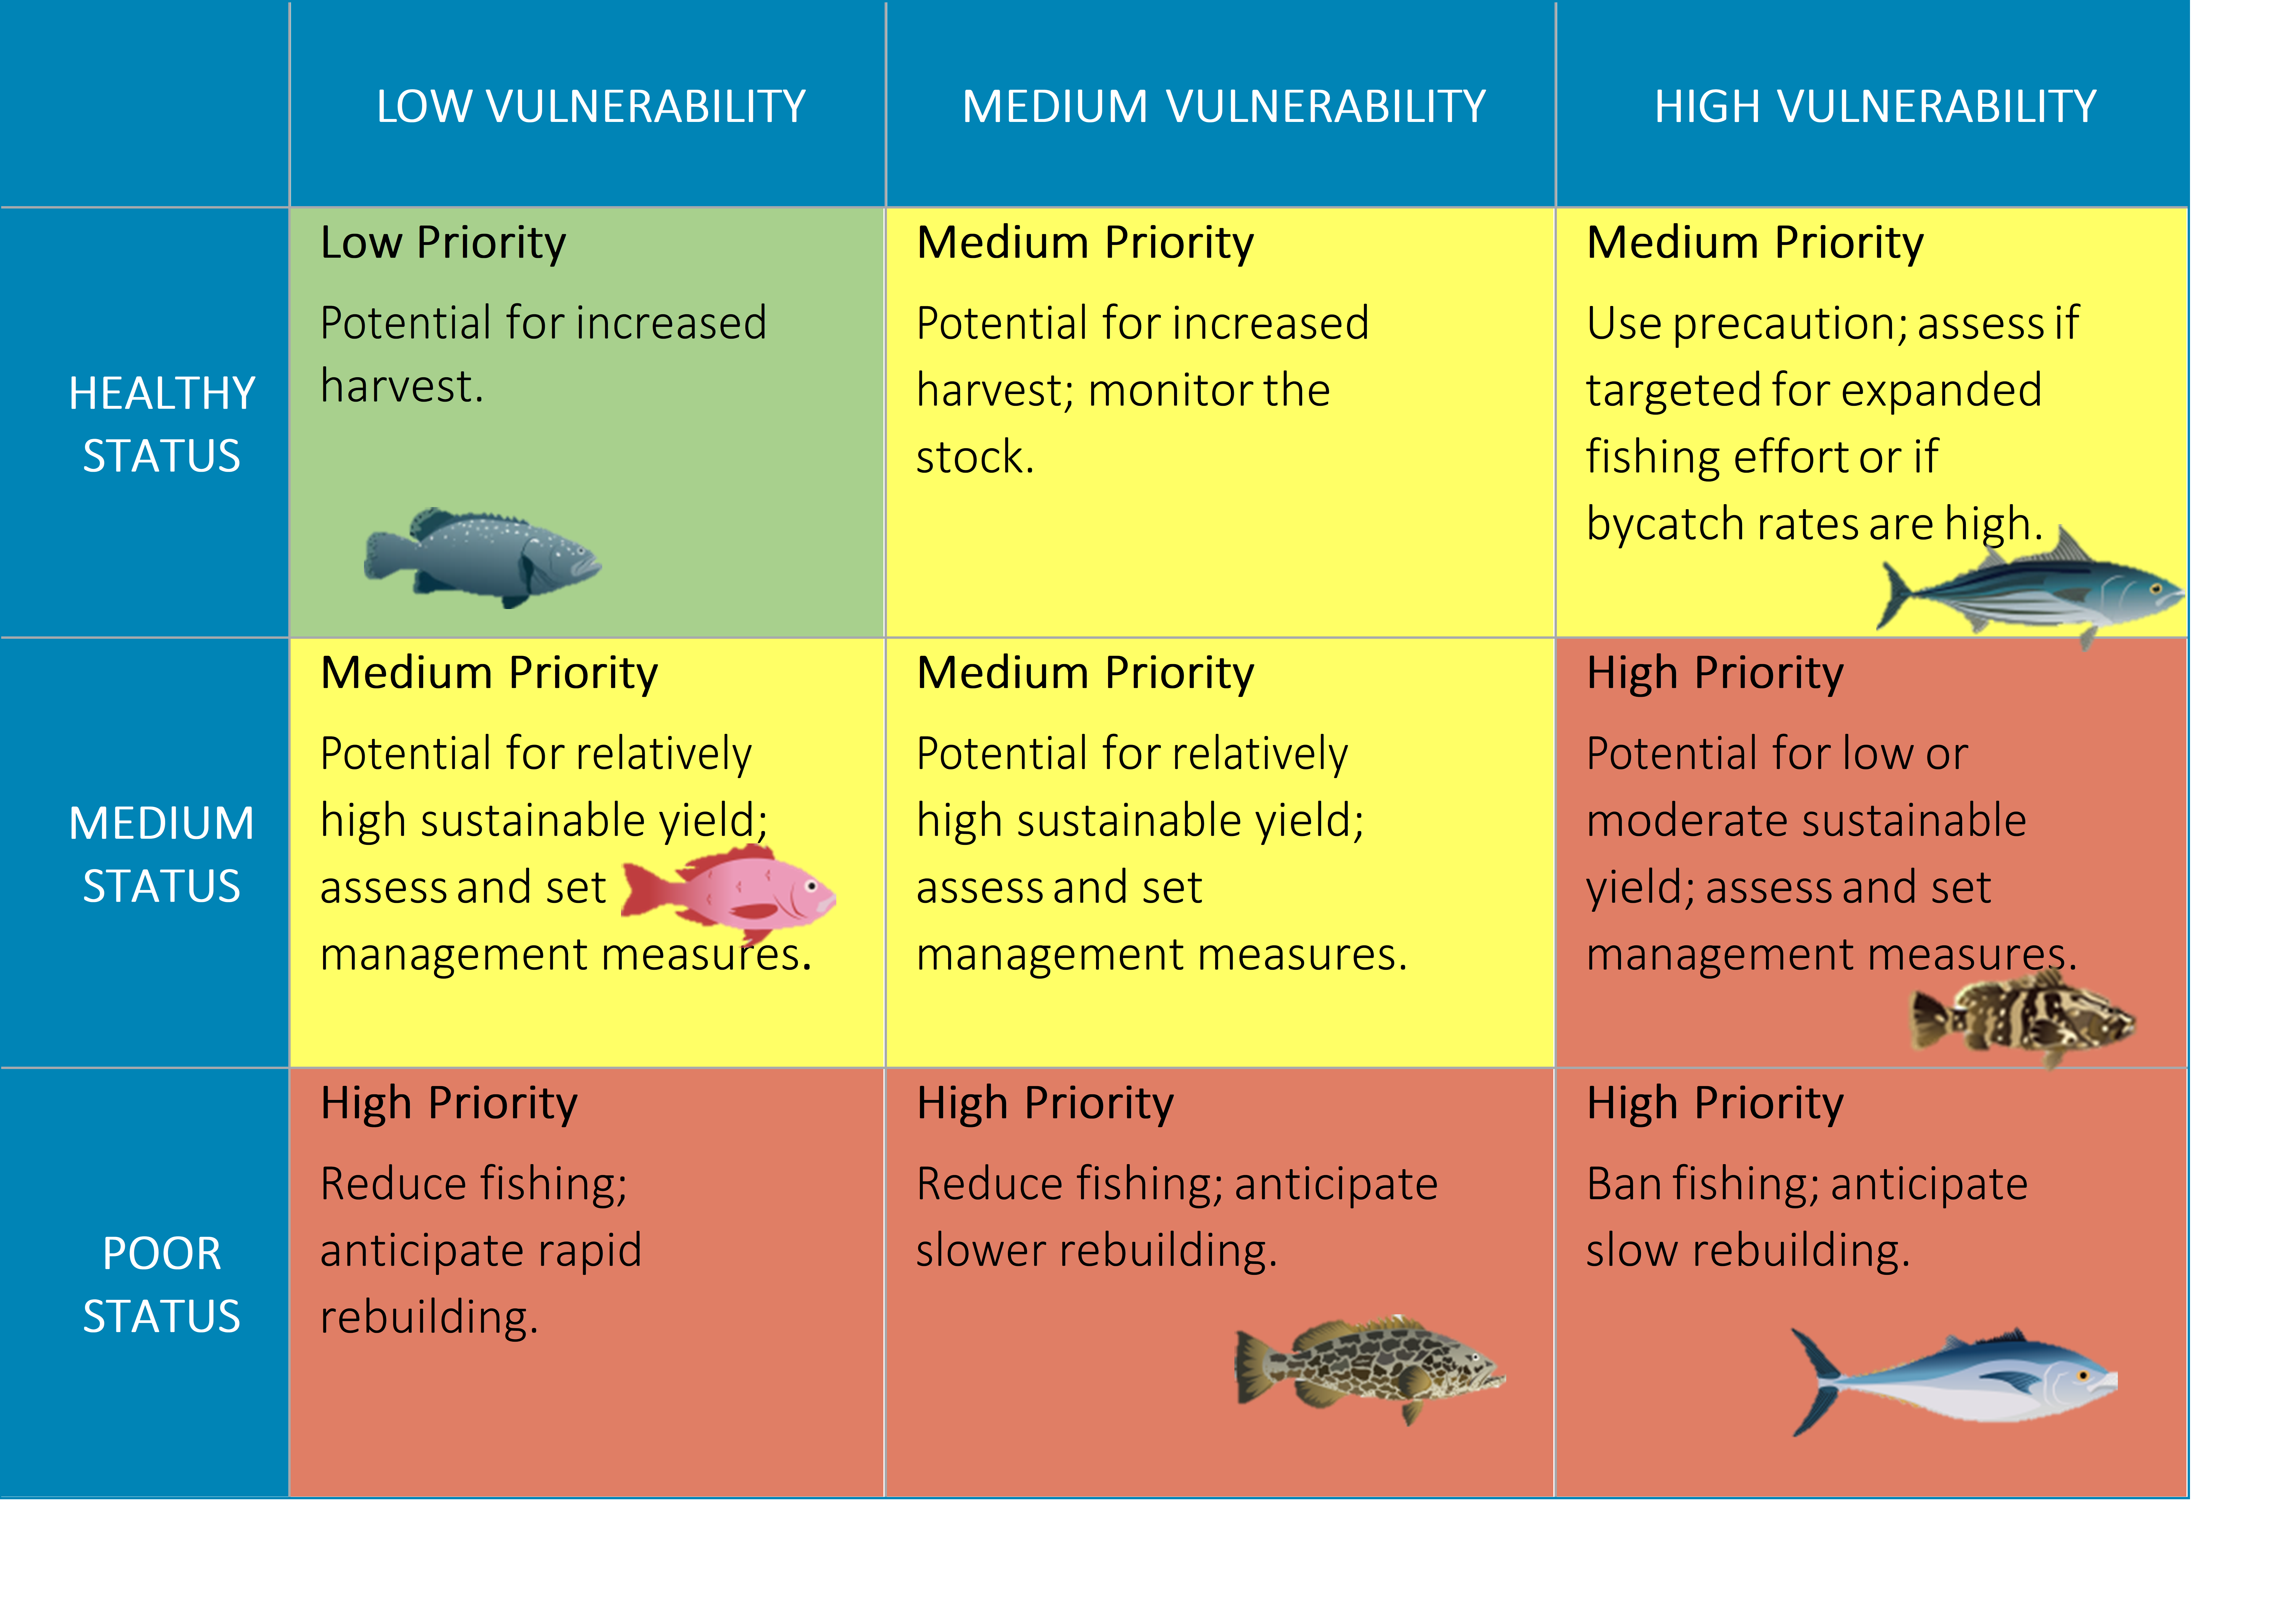
STEP 6, TABLE 1a | EXAMPLE ORGANIZATION MATRIX
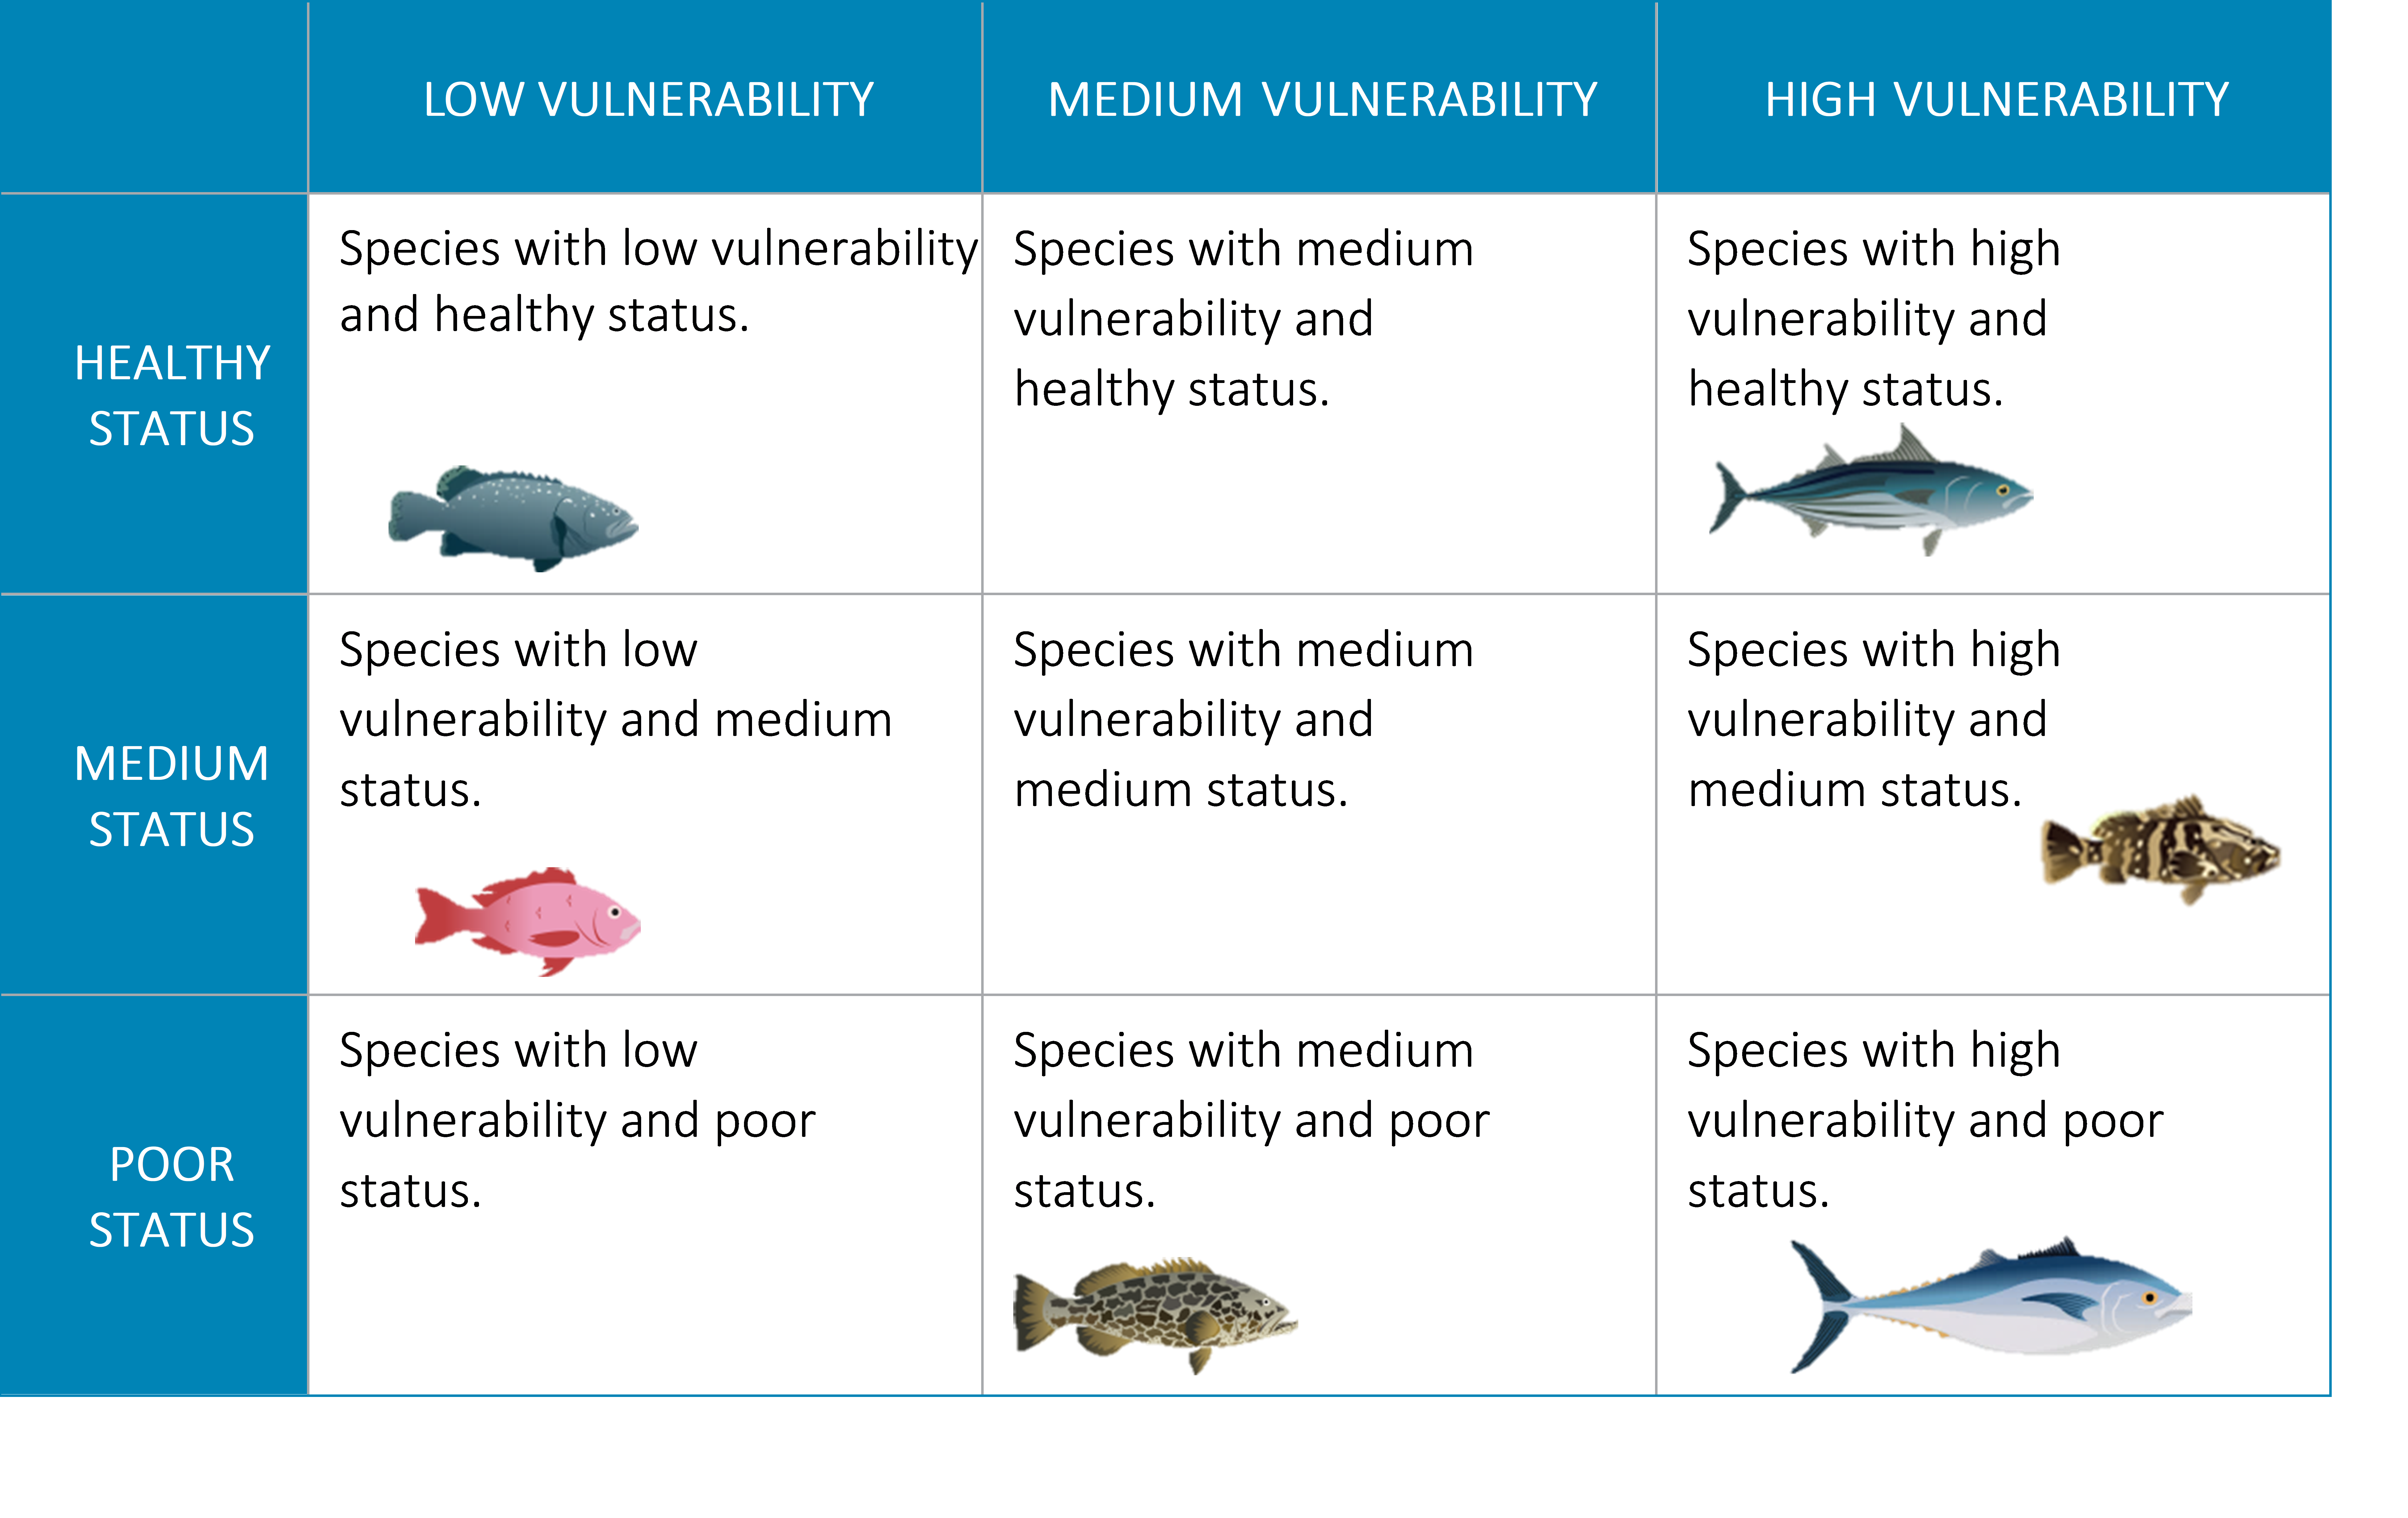
Stocks caught by the fishery are first organized into the 9 cells of the table based on their vulnerability levels (from Step 4) and depletion/ health statuses (from Step 5).
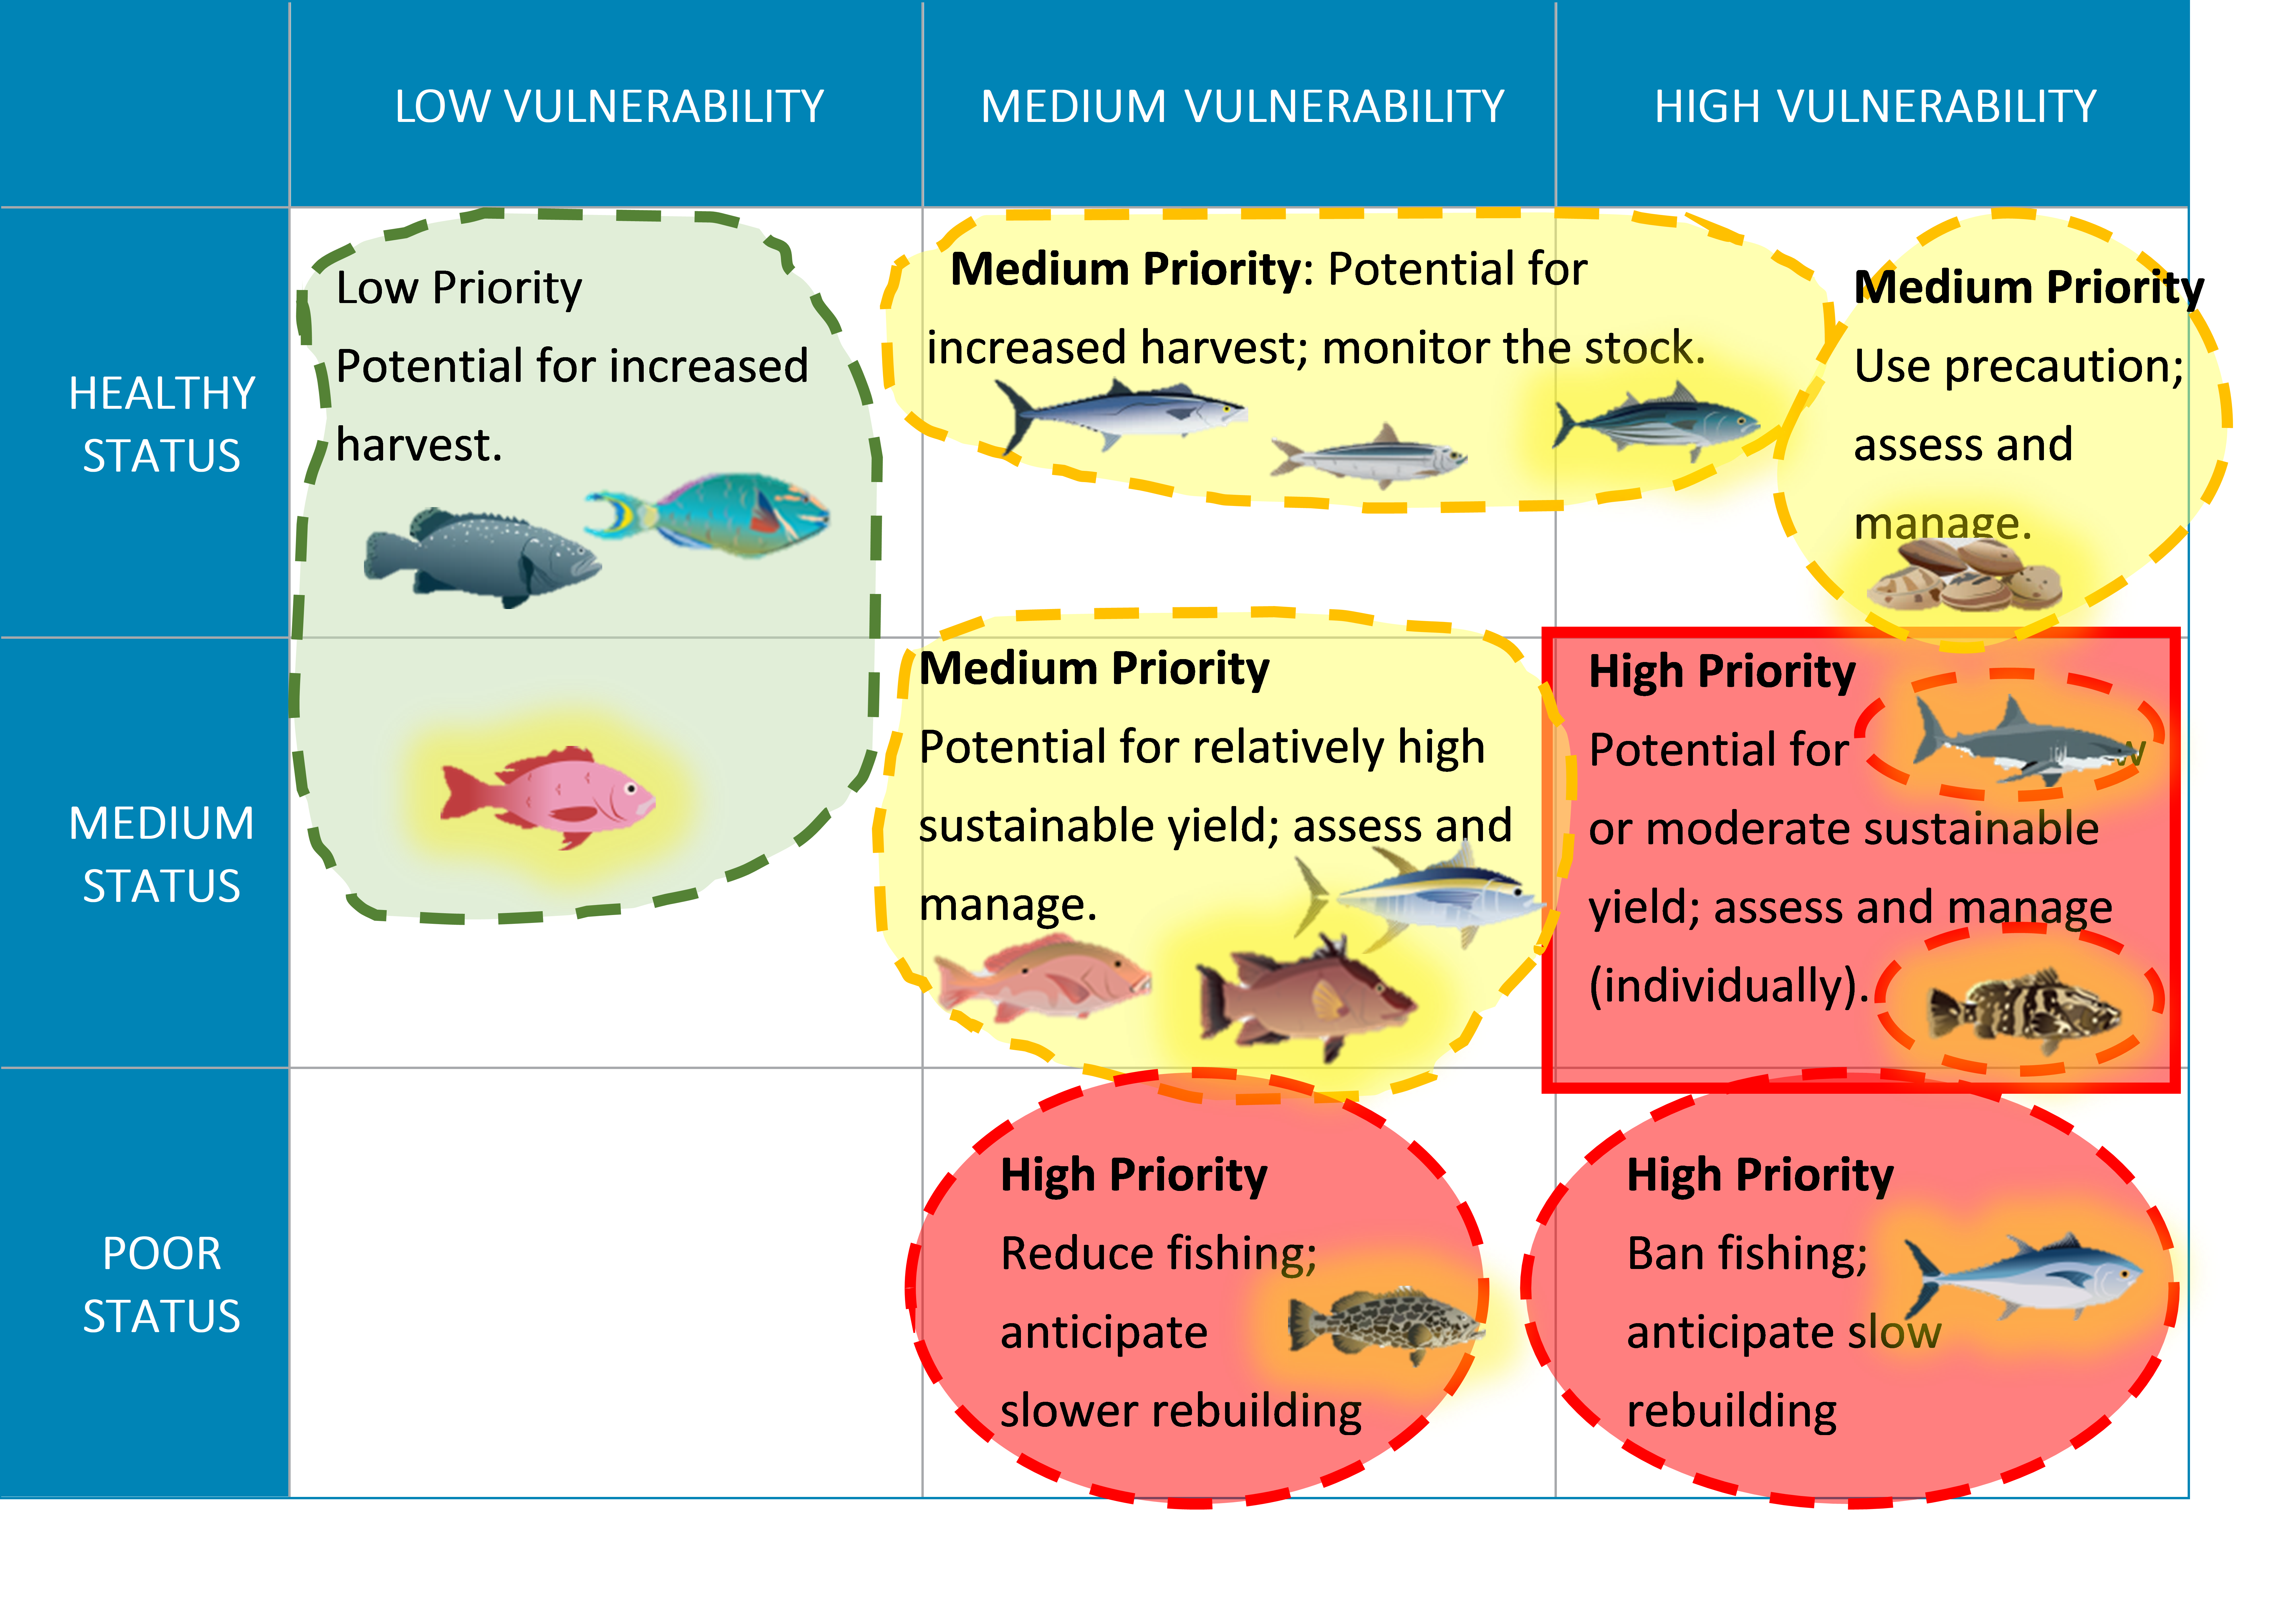
STEP 6, TABLE 1b | EXAMPLE ORGANIZATION MATRIX PLUS MANAGEMENT BASKETS (FOR MULTISPECIES FISHERIES)
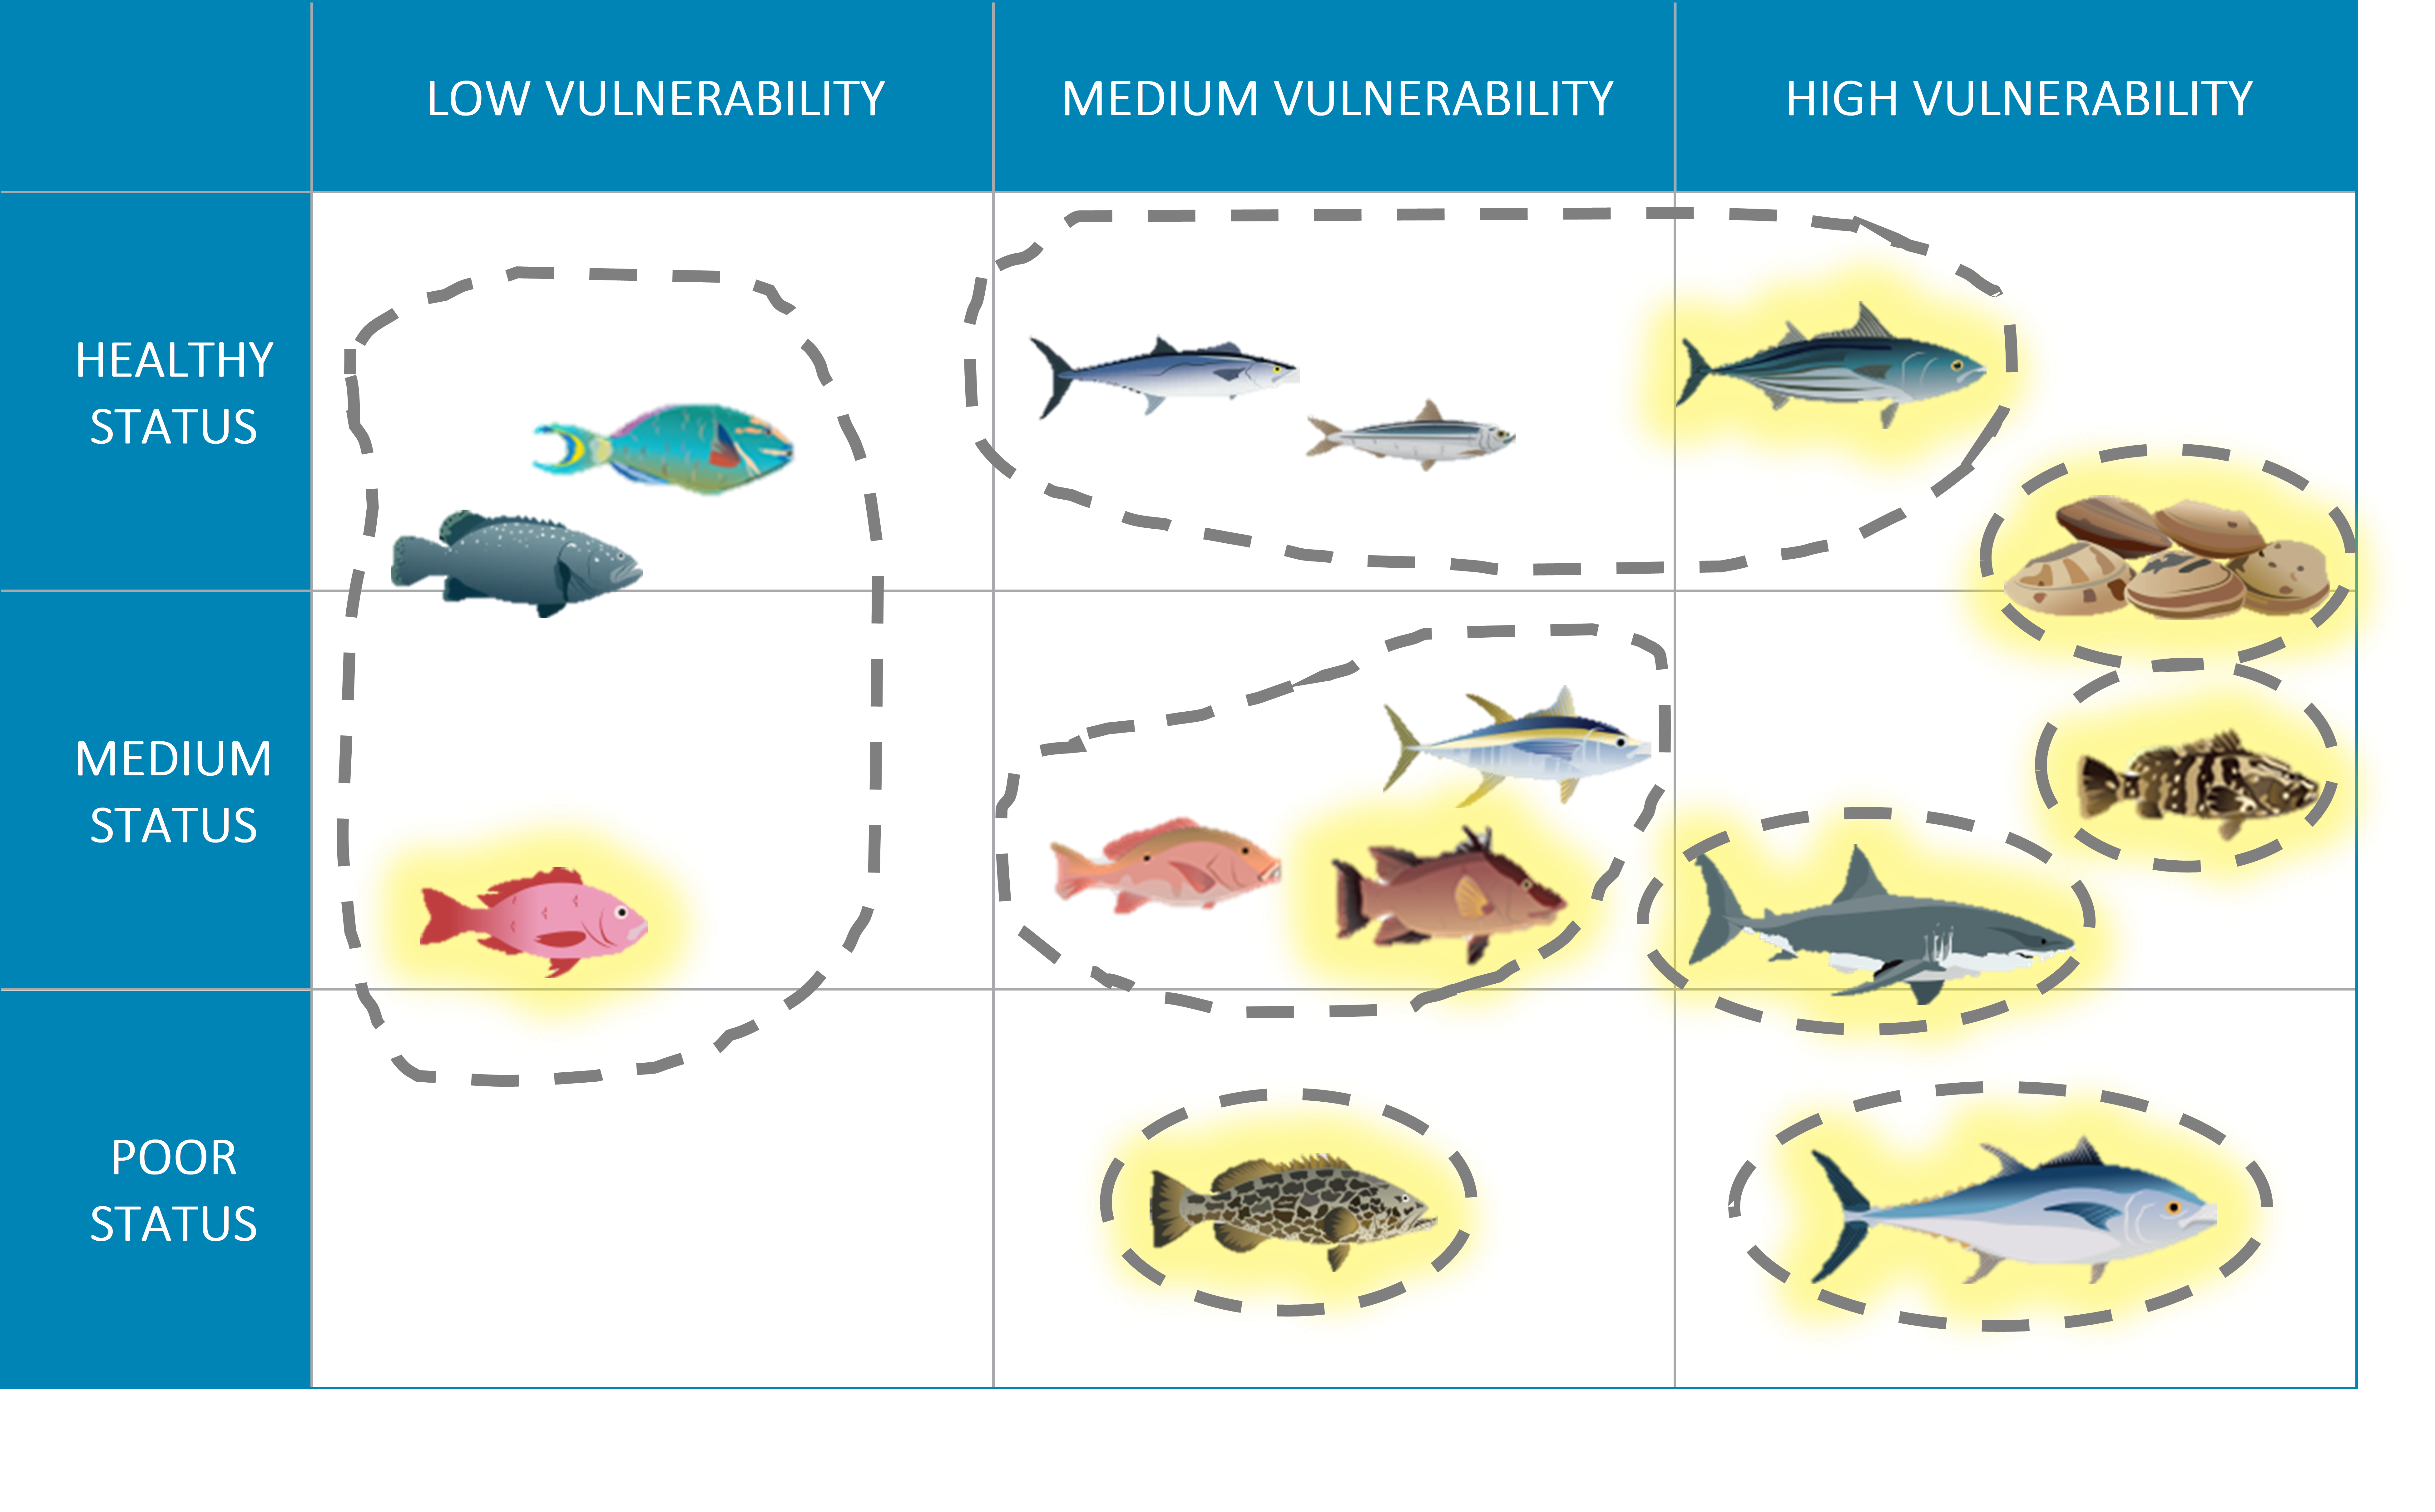
In multispecies fisheries, where many species are caught at the same time with the same gear, species can be organized into “management baskets” based on their vulnerability and status levels (i.e. placement in the table), but also incorporating catch methods, risk tolerance, and value (commercial and social). The 9 cells of the table can be seen as a starting point for the creation of management baskets, and managers can decide to merge cells or split species out, as appropriate for their fishery. In the example in this table (Table 1b), managers have created eight baskets by grouping all species in the Low Vulnerability column (the parrotfish, black grouper, and silk snapper), grouping three species with Healthy Status, but Medium and High Vulnerability (a sardine, a mackerel, and the skipjack tuna), and separating out (creating baskets of one) all the species with Poor or Moderate Status, as well as the clams, which have Healthy Status and High Vulnerability (like the skipjack tuna), but are caught with a different gear/ method than the tuna.
Once the baskets have been defined, at least one “representative species” must be selected from each basket for which additional assessments may be conducted, and management strategies defined, which will then be applied to all species in the basket. Representative species (for baskets containing more than one species) should be chosen based on: which species has the most data available; which species has the highest vulnerability score of the group (choose this species as the representative to be precautionary); which species has a vulnerability score that falls right in the middle of the others in the group; and which species has characteristics/ life cycle patterns and behaviors that might make it a good representative for the others in the group (e.g., perhaps one species uses multiple key habitats throughout its life). Finally, note that the criteria applied to choose the representative species may be different for each group. In Table 1b above, representative species for each basket are highlighted in yellow. In this example, fisheries managers would carry forward 8 species for further assessment and management, rather than all 12 that their fishery impacts.
When creating management baskets, managers must keep in mind the tradeoffs between having more baskets (and therefore more representative species to complete detailed assessments on) with fewer species in each, and having fewer baskets that each contain wider ranges of vulnerability, health status, or both. For instance, in the example above the basket that groups all species in the Low Vulnerability column contains two species that are very healthy, but one species – the silk snapper – that is less so. If managers are not careful when developing management tactics for this basket of fish the snapper may be at risk of overfishing. Similarly, the basket that combines the sardine and mackerel (both Medium Vulnerability stocks) with the skipjack tuna (a High Vulnerability stock) puts the tuna at a greater risk. These risks can be minimized by emphasizing vulnerability when creating the management baskets, assessing and managing the most vulnerable species separately, or selecting the lowest health/ highest vulnerability species in each basket as the representative species. Importantly, this may not always be the species fishers and managers are most interested in from an economic perspective.

Once species have been organized by vulnerability and depletion (and management baskets have been created/ representative species selected if working in a multispecies fishery), managers, scientists, and fishers can work together to agree on an appropriate prioritization scheme – i.e. which cells/ baskets should be considered a high priority for further assessment and potentially immediate precautionary management, which are low priority, and can continue to be fished as they have been without additional examination or management action in the immediate term, and which fall in the middle of this spectrum. See Tables 2a and 2b for examples.
Management guidance can also be developed for each cell, basket, or prioritization class (i.e., all the “Medium Priority” cells) at this time. Conversations with local fishery stakeholders and managers to determine correct management guidance for each cell/basket is recommended. Management guidance will vary depending on the value of the stock(s) for fishing and for other uses (e.g., tourism, recreational fishing or ecological role), risk tolerance and special status (i.e., threatened or endangered species).
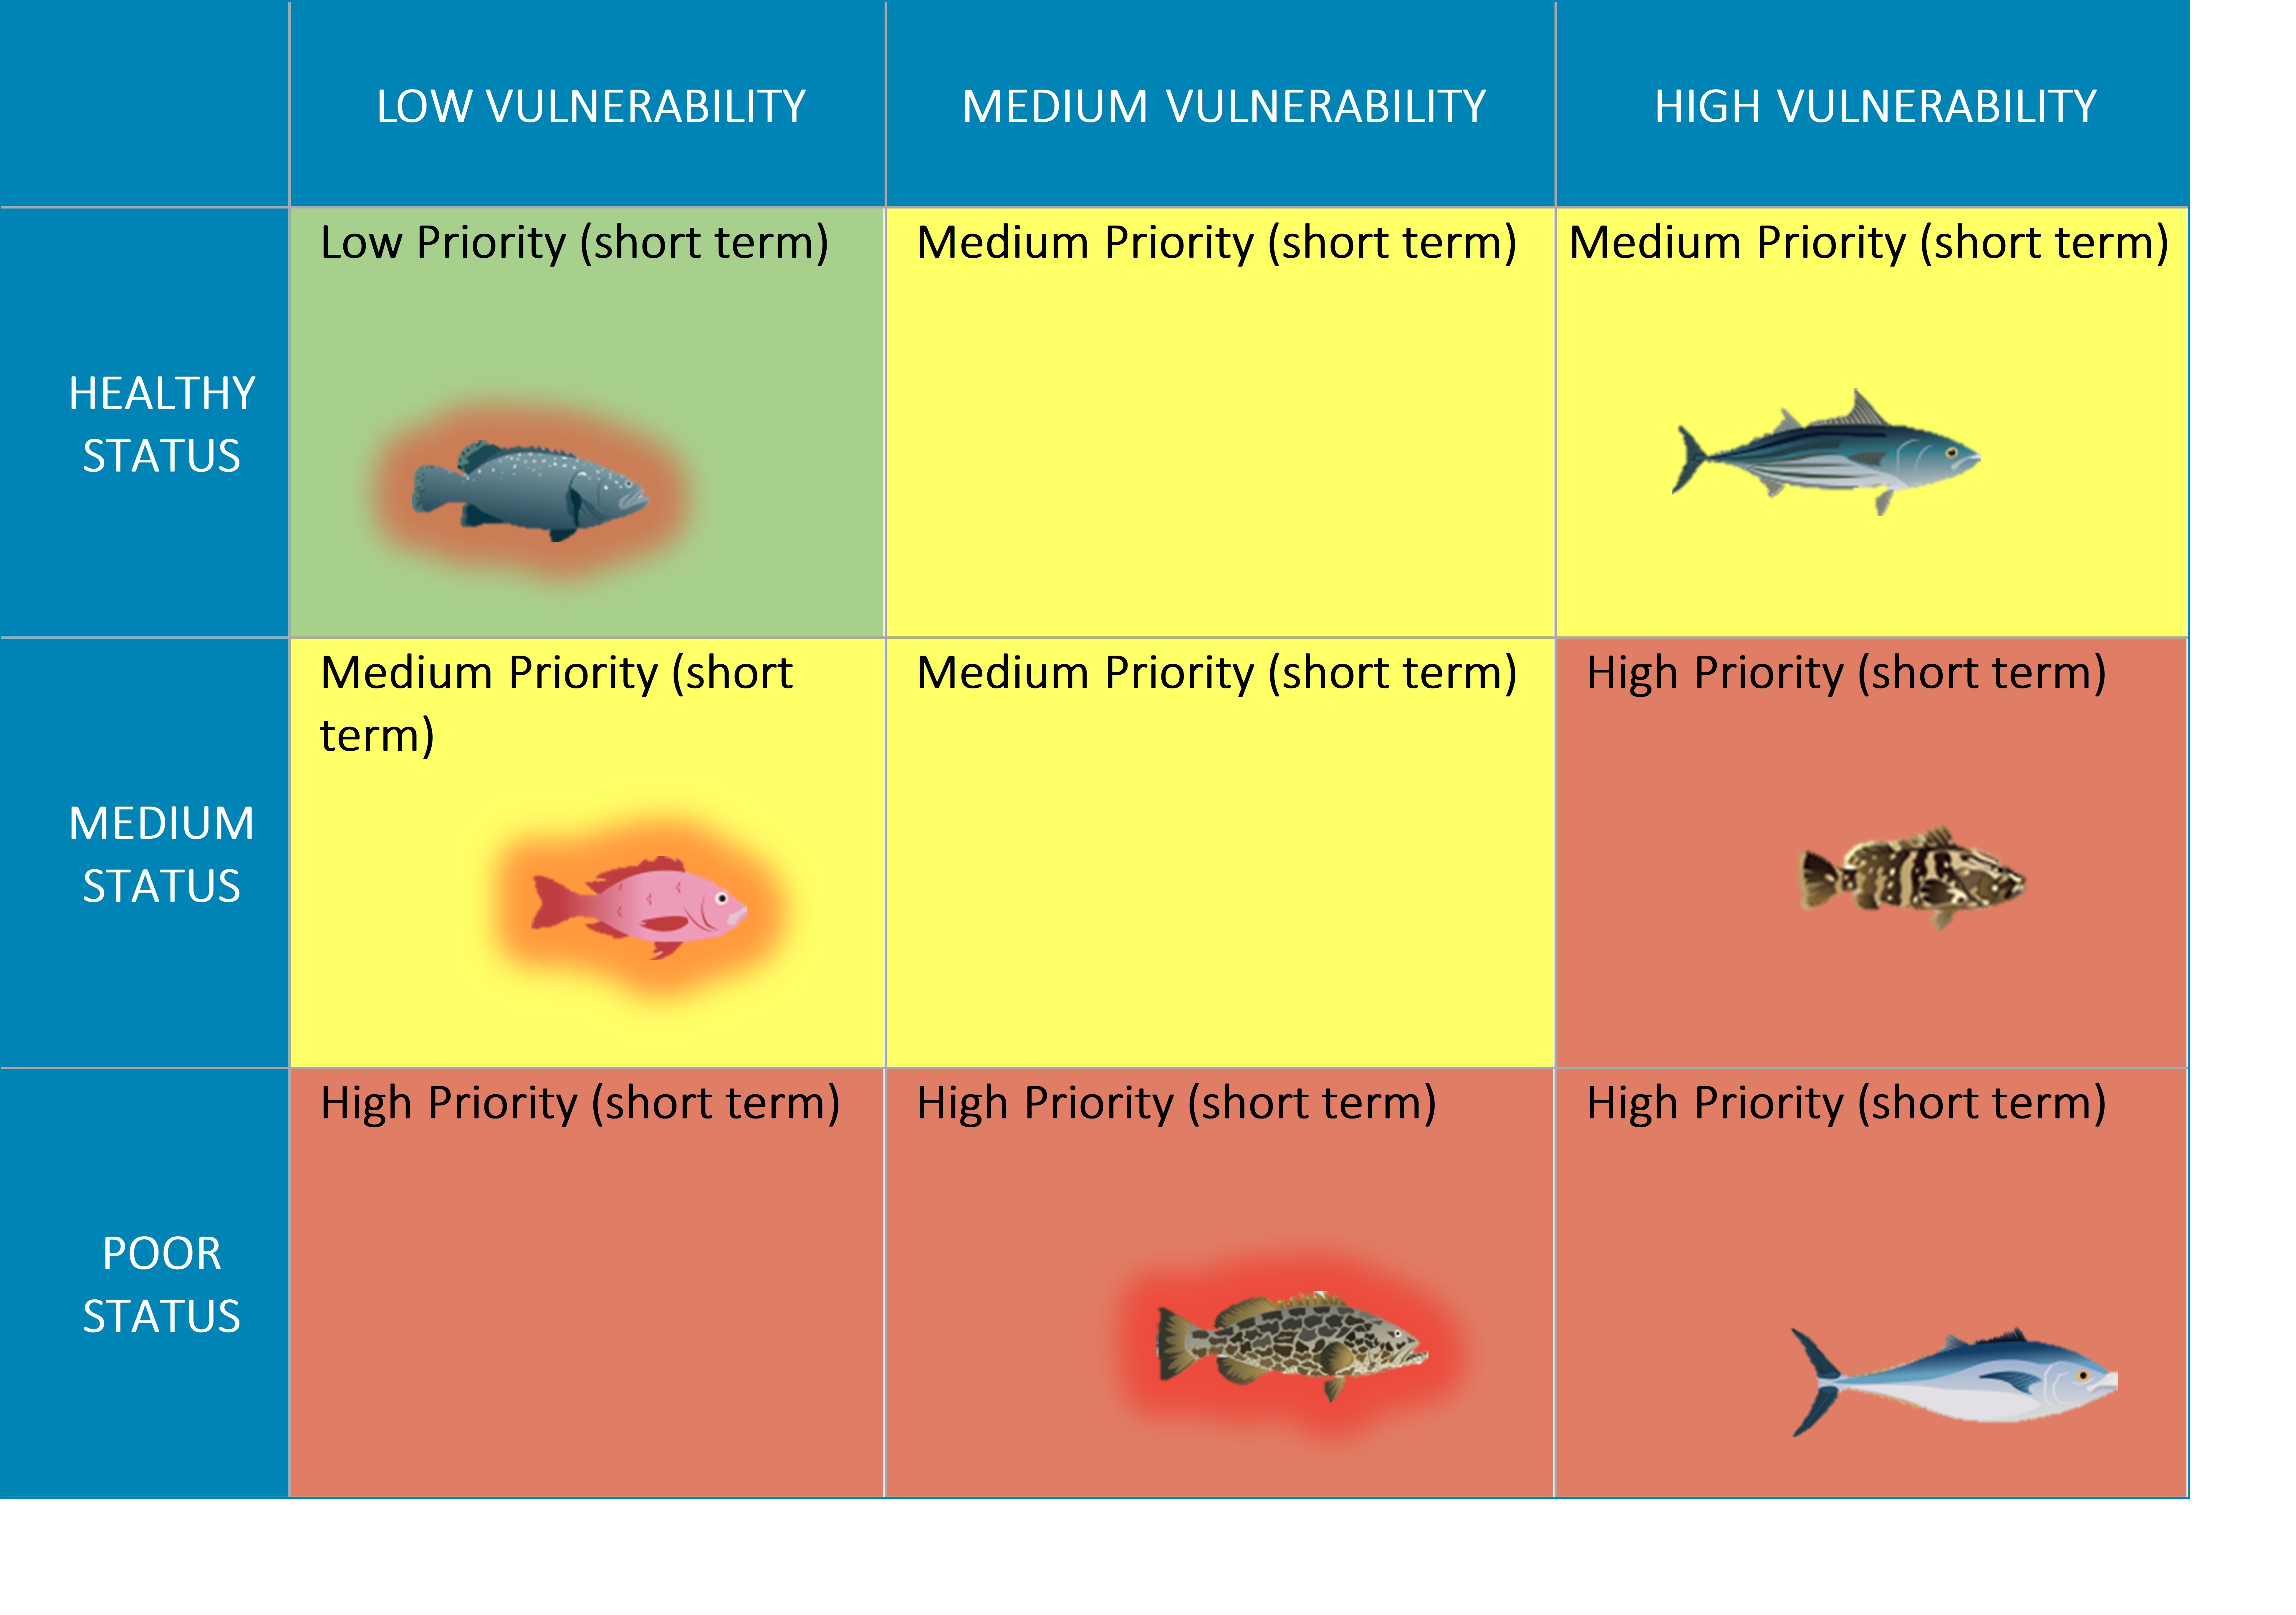
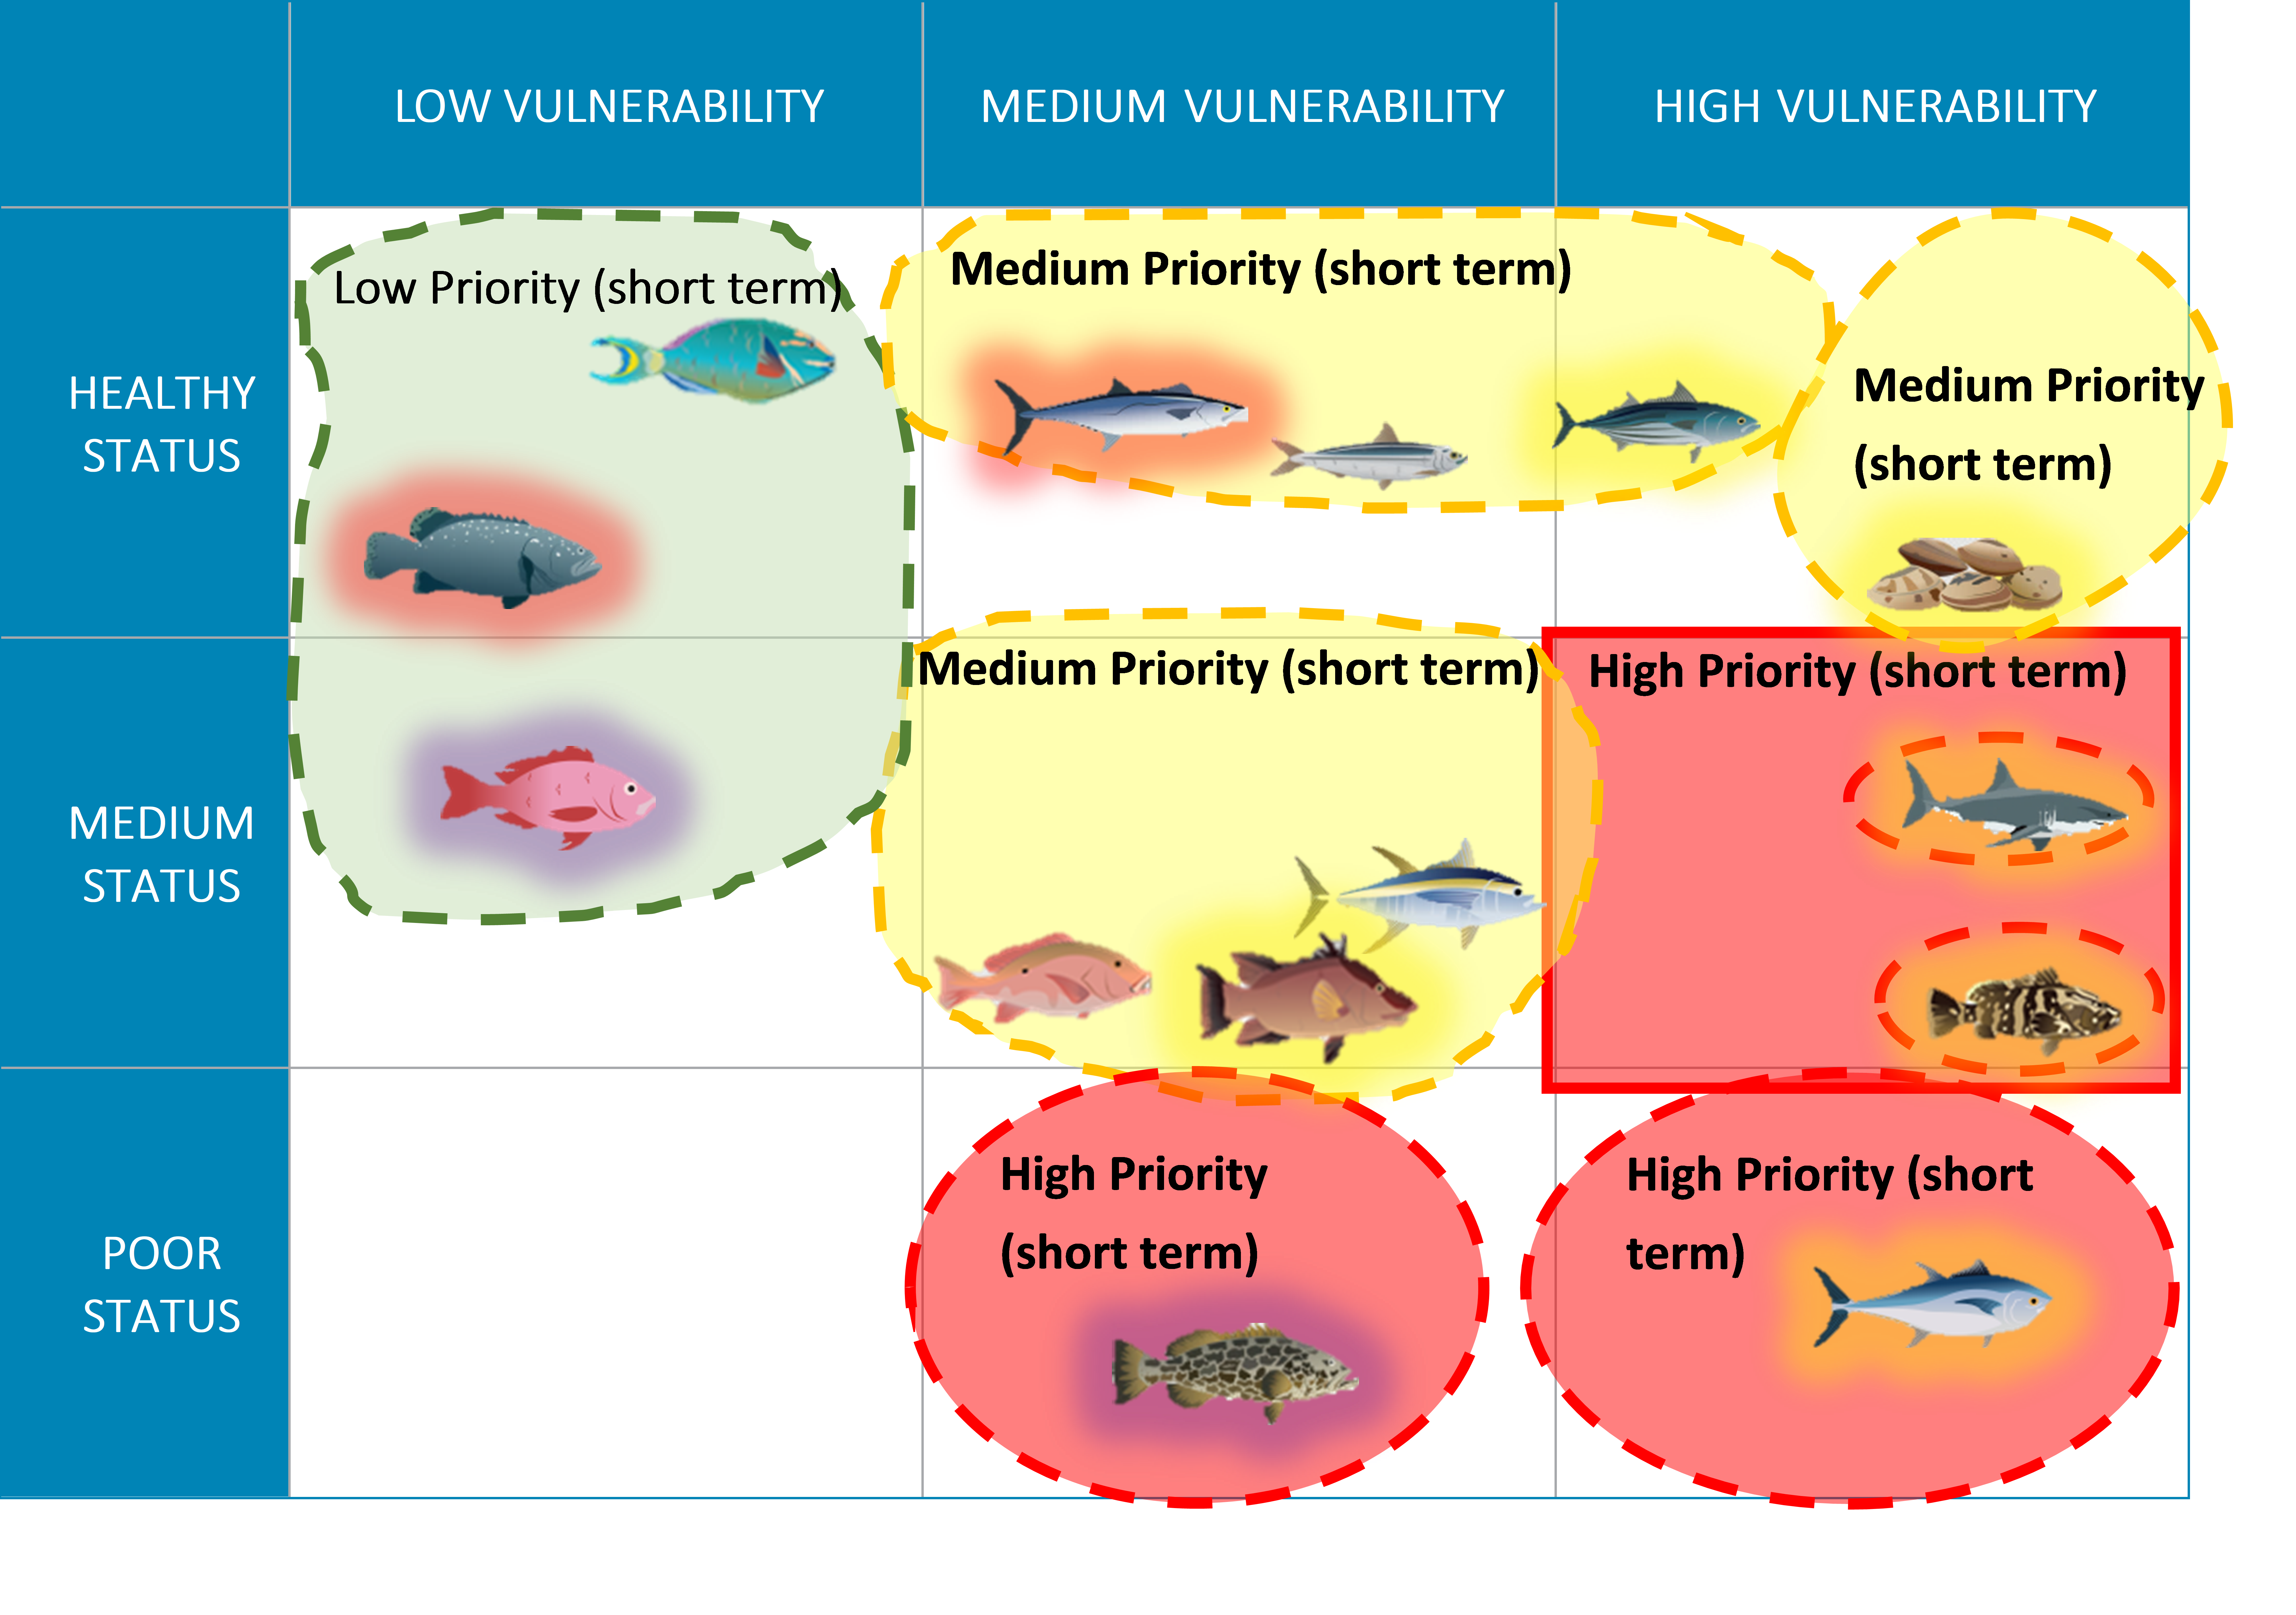
STEP 6, TABLE 2a | PRIORITIZATION MATRIX
 STEP 6, TABLE 2b | PRIORITIZATION MATRIX WITH MANAGEMENT BASKETS (FOR MULTISPECIES FISHERIES)
When working with management baskets in a multispecies fishery, managers may choose to prioritize and generate management guidance based on baskets rather than based on cells of the species organization matrix. Note that doing so may result in different guidance for some species than would have been provided based on individual cells, depending on how baskets are created, and which species are selected as representatives. For instance, in the example above, with management baskets organized as in Table 2b, the skipjack tuna and the silk snapper have both be assigned different guidance (”Potential for increased harvest”) than they would have been based on Table 2a, above, because they are grouped into baskets with species in different cells of the table. Note also that in each case where the determination is made that more assessment and/or monitoring is warranted, only the representative species for that basket (the species highlighted in yellow) would actually be assessed and monitored, and its scores and results would be used to make decisions about all species in its basket.
Different species respond differently to climate change impacts, and this can affect priority setting and management. For this reason, we strongly suggest that information about species’ individual vulnerabilities to climate change also be considered during this prioritization process. Climate vulnerability can be estimated with a formal species-by-species Climate Vulnerability Analysis (e.g., see Method 3 under Step 1), or, if that level of data is unavailable, it can be inferred from an understanding of system-level climate impacts and a more qualitative thought exercise to consider each species’ likely tolerance of/ adaptability to these system changes (e.g., see the questions provided in the Appendix to the Climate Impact Profile Template – Method 1, Step 1). Species that are determined to be the most vulnerable to climate changes should be highlighted at this step for further monitoring and evaluation. These species should be evaluated with the climate-relevant Performance Indicators that are tied to Climate Resilience Goals (see Step 7). Tables 3a and 3b provide examples of this process.
STEP 6, TABLE 3a | INCORPORATING CLIMATE VULNERABILITY INTO PRIORITIZATION MATRIX
In Table 3a, the three species highlighted in red (the black grouper, silk snapper, and leopard grouper) have been identified as highly vulnerable to climate change. These species should therefore be monitored for indications of expected climate-driven impacts, and climate-relevant management guidance should be developed to be responsive to identified changes in these metrics (see Steps 7 and 8). In the example above, the two species that fell into the Low and Medium Priority cells based on their current status and vulnerability to the fishery (black grouper and silk snapper) may not be elevated for additional fishery assessments at Step 9, but they should still be monitored for changes in climate change-related Performance Indicators. Conversely, the leopard grouper was already identified as a High Priority species based on current status and vulnerability to the fishery. This species should therefore be evaluated with the additional Step 9 assessments to better understand the current impact of the fishery, in addition to evaluating it against climate change-related Performance Indicators.
STEP 6, TABLE 3b | INCORPORATING CLIMATE VULNERABILITY INTO PRIORITIZATION MATRIX WITH MANAGEMENT BASKETS (FOR MULTISPECIES FISHERIES)
In Table 3b, our hypothetical multispecies fishery, species highlighted in yellow were selected by stakeholders as the representative species for their baskets in the previous part of this process. Species highlighted in red have been identified as especially vulnerable to climate change (and should thus be monitored for indications of these impacts), and species highlighted in purple fall into both categories – they were identified as basket representatives by stakeholders and they are likely to be especially vulnerable to climate change. These two species (silk snapper and leopard grouper) should thus be evaluated with the additional Step 9 assessments to better understand current impacts of the fishery, as well as monitored for changes in climate-related Performance Indicators (see Step 7).